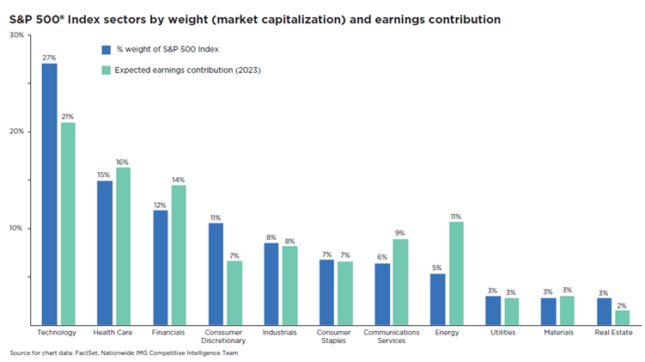
One way to examine changing trends in stock market performance is to analyze sector weighting changes for the S&P 500® Index. These recurring shifts in the composition of the benchmark stock Index can offer insight into how different factors, such as cyclicality, long-term growth potential, and valuation, may impact stock performance in the future.
Currently, the Information Technology sector is the largest S&P 500 sector by weight, accounting for around 27% of the S&P 500 Index. This is a significant increase from 1990, when the tech sector comprised just 6.3% of the Index. Since 2008 (following the Global Financial Crisis), technology has consistently outweighed all other S&P 500 sectors. For example, as of the end of 2022, the tech sector overshadowed the Health Care, Utility, and Financial sectors by more than nine, 22, and 14 percentage points, respectively.

The sizable outperformance of tech stocks between 2016 and 2021 created valuations that, in many respects, may not be sustainable in the current interest rate environment. The outsized influence of tech company earnings on the S&P 500 is important to understand. From a valuation standpoint, the 20-year average forward price-to-earnings (P/E) ratio for the S&P technology sector is around 18-times next 12-months earnings. As of this writing, the tech sector is trading at 22-times forward earnings, well above the long-term average.
One of the primary drivers of the tech sector’s lofty valuation in recent years was the COVID-influenced demand for technology products and services. For perspective, consider that at the outset of the pandemic, the forward P/E ratio for the S&P tech sector surged from 16-times projected earnings to over 28-time earnings in just six months (March 2020 -August 2020) as investors sought opportunities in technology stocks amid lower rates from the Federal Reserve.
It’s possible that last year’s rotation away from stocks with high P/E ratios could signal a longer-term trend change for big technology stocks. The chart above illustrates the estimated earnings contribution of tech stocks for 2023, almost eight percentage points below its market capitalization weight of 27%. Those earnings projections may run into headwinds as the economy slows and challenges the elevated stock valuations of these firms. If tech company earnings continue to weaken in the coming quarters, we may see further rotation away from the sector as investors seek more stable earnings in the near term.


