

Shifts in stock market leadership can be extreme
Small caps have led the market recently, taking over from large caps. What will it take for the rally to continue?

Narratives help investors make sense of market trends, but there’s a danger in following them without critical assessment or an objective perspective. One narrative tested over the past year has been that disinflation, or a fall in inflation, should result in a decline in interest rates. The actual trend in interest rates for much of this year, where rates have risen even as the pace of inflation growth has slowed, seems to defy this narrative.
Since the peak of the inflation cycle in June 2022, when the Consumer Price Index (CPI) annual growth rate hit 9.1%, the yield on the 10-year Treasury has climbed approximately 140 basis points, from around 3.0% to 4.4% as of late. In another paradox, the 10-year Treasury yield is up about 50 basis points since the “Goldilocks” CPI reading in July 2023.
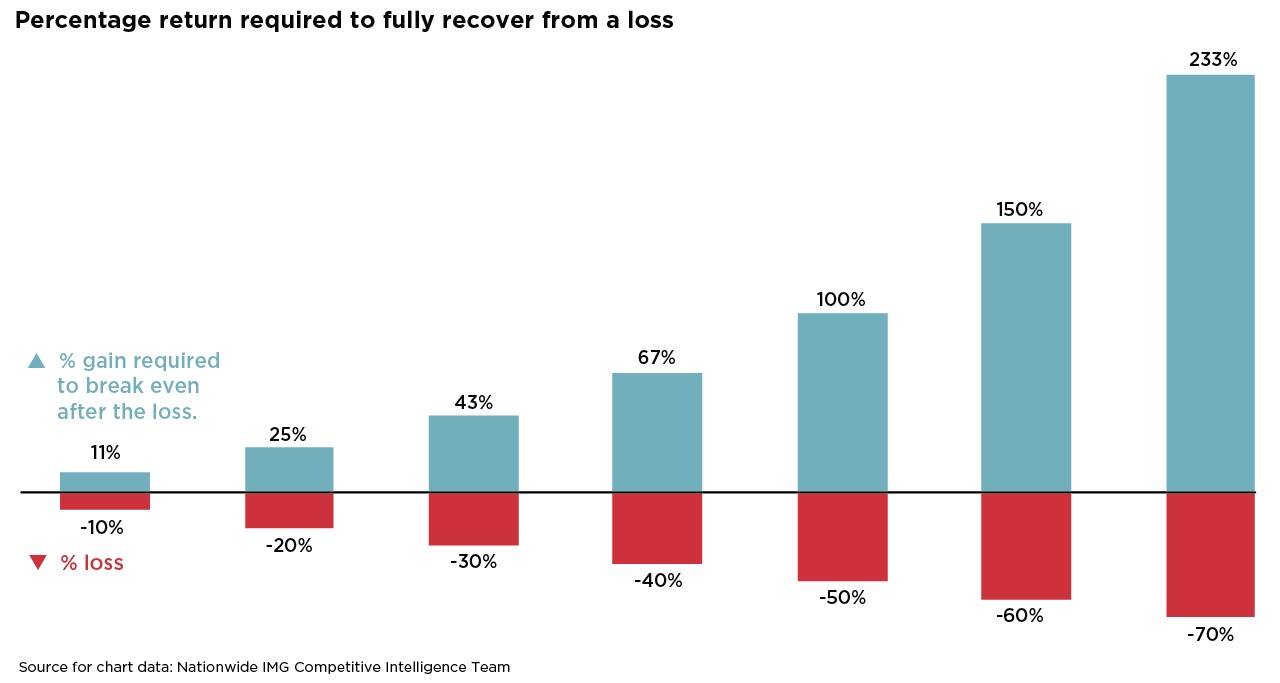
Blind faith in market narratives can hamper investors’ ability to understand risk. Investors often need to pay more attention to the impact of a significant loss on a single investment and realize that a more substantial gain is required to break even. As illustrated in the accompanying chart, as the loss on an investment increases, the gain necessary to recover fully from that loss rises exponentially. For instance, to recover from a 10% loss, an investor needs an 11% gain. To recover from a 50% loss, an investor needs a 100% gain. During the bear market of 2007-2009, the S&P 500® Index lost approximately 55%, which required an approximate gain of 123% to break even.
Understanding the importance of recovery time, or the number of months potentially needed to break even, can help investors make informed decisions on asset allocation and risk management. Rather than basing investment decisions on narratives or emotions, a well-structured investment plan is personalized to an investor’s specific risk tolerance, objectives, and time horizon, helping to create a resilient portfolio for the long term.
This material is not a recommendation to buy or sell a financial product or to adopt an investment strategy. Investors should work with their financial professional to discuss their specific situation.
Except where otherwise indicated, the views and opinions expressed are those of Nationwide as of the date noted, are subject to change at any time and may not come to pass.
S&P 500® Index: An unmanaged, market capitalization-weighted index of 500 stocks of leading large-cap U.S. companies in leading industries; it gives a broad look at the U.S. equities market and those companies’ stock price performance.
S&P Indexes are trademarks of Standard & Poor’s and have been licensed for use by Nationwide Fund Advisors. The Products are not sponsored, endorsed, sold or promoted by Standard & Poor’s and Standard & Poor’s does not make any representation regarding the advisability of investing in the Product.
Nationwide Funds are distributed by Nationwide Fund Distributors LLC, member FINRA, Columbus, Ohio. Nationwide Investment Services Corporation, member FINRA, Columbus, Ohio.
Nationwide, the Nationwide N and Eagle and Nationwide is on your side are service marks of Nationwide Mutual Insurance Company. © 2023 Nationwide
NFN-1526AO

