

Shifts in stock market leadership can be extreme
Small caps have led the market recently, taking over from large caps. What will it take for the rally to continue?

Market participants and economists frequently seek out specific data combinations that can serve as reliable signals of a turning point in the economy. One of the most popular indicators is the Conference Board’s Leading Economic Index (LEI), which tracks ten barometers of economic activity such as building permits, average weekly initial claims, interest rate spreads, etc.
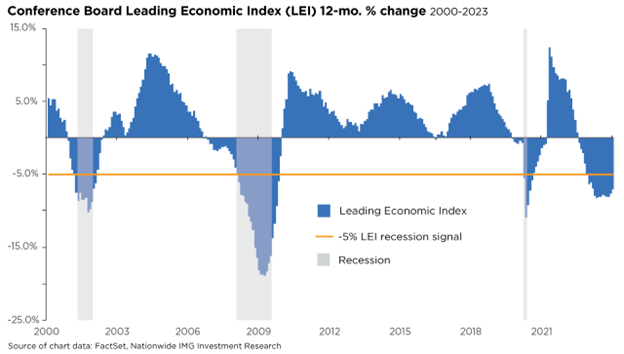
Some investors consider the LEI one of the most reliable indicators to predict economic downturns. However, the LEI has decreased for 22 consecutive months through December 2023, even though the U.S. economy has delivered impressive economic growth at least over the past 12 months. In other words, the LEI continues to signal a recession, yet the most recent reading (December) indicated a milder pace of contraction and broad-based improvements in the index’s components. Six LEI components delivered positive contributions last month, including rising stock prices, easing credit conditions, and fewer jobless claims. While some may argue the LEI is broken, a closer examination reveals a potential counterpoint, highlighting the unorthodox nature of the recent business cycle.
First, since 1960, the average lead time between the LEI falling 5% and the start of a recession has been around three months. Yet, the Index dropped 5% in November 2022, and a recession has not materialized. One possible explanation may be the unique nature of the post-pandemic economy. The unusual impact of COVID-19 on the economy has likely resulted in data inconsistencies, policy distortions, and cycle anomalies, which have, in turn, affected the LEI components.
Second, investors should consider that the LEI is impacted more by manufacturing data and less by services, which drive 70% of the U.S. economy. Lastly, for much of 2023, the divergence between Gross Domestic Product (GDP) growth and the LEI stemmed from weaker sentiment data, while the hard data proved more resilient. As a case in point, consider the robust 4.9% GDP report for the 3rd quarter. Again, this highlights the discord in economic data that has plagued forecasts since 2020.
The incremental improvements in December’s LEI report suggest that the likelihood of an economic downturn is fading, potentially lending credence to the Index’s detractors. However, it’s also possible that the LEI has been accurate all along, and the Index’s negative readings signaled a recession during Q1 of 2023. Still, the National Bureau of Economic Research (the official arbiter of U.S. recessions) didn’t pick up on it because of the unorthodox nature of the post-pandemic business cycle.
This material is not a recommendation to buy or sell a financial product or to adopt an investment strategy. Investors should work with their financial professional to discuss their specific situation.
Except where otherwise indicated, the views and opinions expressed are those of Nationwide as of the date noted, are subject to change at any time and may not come to pass.
Nationwide Funds are distributed by Nationwide Fund Distributors LLC, member FINRA, Columbus, Ohio. Nationwide Investment Services Corporation, member FINRA, Columbus, Ohio.
Nationwide, the Nationwide N and Eagle and Nationwide is on your side are service marks of Nationwide Mutual Insurance Company. © 2024 Nationwide
NFN-1578AO

