

Shifts in stock market leadership can be extreme
Small caps have led the market recently, taking over from large caps. What will it take for the rally to continue?

The second quarter of 2023 was just as bewildering as the first for those market participants skeptical about economic data and the markets. Risk assets continued to soar, particularly in the technology, consumer discretionary, and communications sectors, outperforming the S&P 500® Index by a respectable margin. Additionally, the yield on the 10-year Treasury rose by approximately 53 basis points from a low of 3.3% on April 6th to 3.8% at the end of Q2.
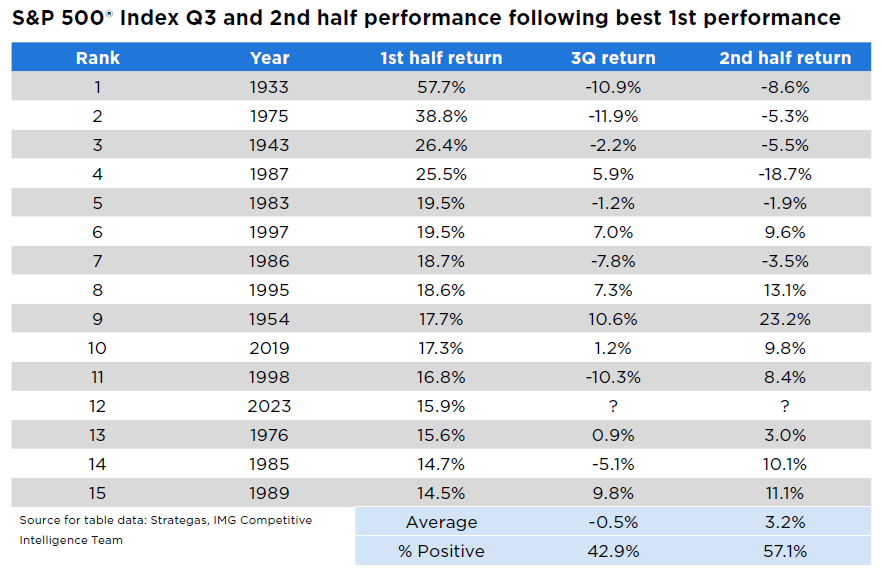
While many investors cheered higher yields in money market accounts throughout the first half of 2023, the NASDAQ Composite Index had its strongest first half since 1983, generating a return of 32.2%. While there were serious concerns in the first half of the year about the health of the banking system, slowing economic growth, and moderating corporate earnings, there’s not much standing in the way of the current market rally. For example, according to Bank of America, since 1932, when the S&P 500 Index returned more than 10% in the first half of the year, the year’s second half produced a positive return 82% of the time.
What’s more, whenever the S&P 500 returned more than 10% in the first half of the year in the aftermath of a negative year (and in 2022, the S&P 500 was down approximately 18.5%,) the upcoming second half of the year saw positive results 86% of the time. Moreover, the next 12 months had positive returns 100% of the time. Although these statistics are encouraging, there are some economic headwinds to consider for the remainder of the year. First, pay close attention to bond yields. For example, when looking at the real 5-year Treasury yield (using the 5-year TIPS yield), the rate has reached a cycle-high of approximately 2.05%. If bonds continue to increase in nominal and real terms thanks to a hawkish Federal Reserve, it may present a challenging backdrop for the equity markets.
Second, company earnings growth for the remainder of the year should be significantly influenced by decreasing inflation for margins and economic growth for revenue growth. Equity price changes may depend on whether expectations for an earnings growth rebound materialize. Third, almost all the gains in the S&P 500 year-to-date have resulted from an increase in the price/earnings (P/E) ratio (i.e., multiple expansion), not earnings growth. To illustrate, from the market low on October 12, 2022 to July 6th, 2023, the next 12-month P/E ratio went from 15.1-times to 19.1-times, while the year-over-year change in the S&P 500’s next 12 months’ EPS remained negative throughout this period.
Can stocks’ summer rally continue? Arguably, after a strong first half, investors should anticipate a market pullback. However, if Q2 earnings come in better than expected and economic data is supportive, the S&P 500 might continue its impressive rally for the remainder of the year.
This material is not a recommendation to buy or sell a financial product or to adopt an investment strategy. Investors should discuss their specific situation with their financial professional.
Except where otherwise indicated, the views and opinions expressed are those of Nationwide as of the date noted, are subject to change at any time and may not come to pass.
S&P 500® Index: An unmanaged, market capitalization-weighted index of 500 stocks of leading large-cap U.S. companies in leading industries; gives a broad look at the U.S. equities market and those companies’ stock price performance.
S&P Indexes are trademarks of Standard & Poor’s and have been licensed for use by Nationwide Fund Advisors LLC. The Products are not sponsored, endorsed, sold or promoted by Standard & Poor’s and Standard & Poor’s does not make any representation regarding the advisability of investing in the Product.
NASDAQ Composite Index: A stock market index of the common stocks and similar securities (e.g. ADRs, tracking stocks, limited partnership interests) listed on the NASDAQ stock market.
Nationwide Funds are distributed by Nationwide Fund Distributors LLC, member FINRA, Columbus, Ohio. Nationwide Investment Services Corporation, member FINRA, Columbus, Ohio.
Nationwide, the Nationwide N and Eagle and Nationwide is on your side are service marks of Nationwide Mutual Insurance Company. © 2023 Nationwide
NFN-1488AO

