

Shifts in stock market leadership can be extreme
Small caps have led the market recently, taking over from large caps. What will it take for the rally to continue?

For much of 2023, narrow market leadership (i.e., the Magnificent Seven stocks) and sizeable valuation gaps among equities widened the performance gap between large-cap growth and large-cap value stocks, with growth outperforming. This trend may create opportunities in value stocks for investors looking ahead to 2024. However, the same return divergence isn’t reflected among small-cap stocks, where growth has consistently underperformed value (illustrated in the accompanying chart by the Russell 2000® small-cap and large cap indexes.)
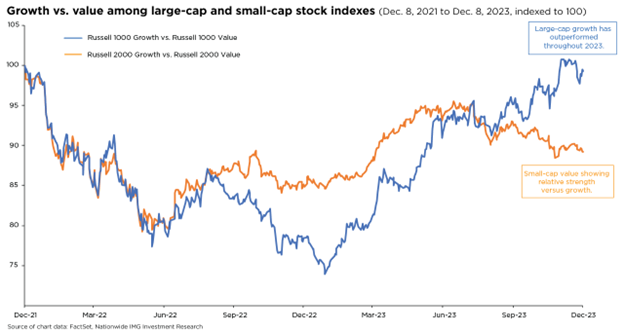
One explanation for the performance gap between large and small-cap growth and value is the differences in sector weightings between the Russell indexes. According to FactSet, technology dominates the Russell 1000® Growth Index with a 51% index weighting as of this writing, while financials are the largest sector in the Russell 1000 Index Value with a 20% weighting. However, the sector emphasis is much different for the small-cap Russell 2000 indexes; industrials represent 23% of the Russell 2000 Growth Index, the highest weighting, followed by health care at 21%. For the Russell 2000 Value Index, financial stocks represent the largest weighting at 25%, followed by industrials at 14%.
A second reason for the performance difference may be investors’ increasing confidence in the economic climate as the consensus views coalesce around the “soft landing” scenario. Value stocks have historically consistently outperformed relative to growth when the economy starts to rebound. A third reason from a valuation perspective (using the following 12-month price/earnings ratio) is that the Russell 2000 Value Index continues to trade at historically attractive levels compared to the Russell 2000 Growth Index, a compelling proposition for long-term investors.
Investors looking at small caps should consider that Russell 2000 growth and value indexes have a fair number of non-earning companies, but less so in the Russell 2000 Value Index (around 33%) relative to the Russell 2000 Growth Index (about 37%.) Finally, several sectors in the Russell 2000 Value Index that were punished by the rise in yields earlier this year (including financials, utilities, and real estate) have benefited from the recent decline in interest rates.
Taking a portfolio position in growth and value is a complex decision with many variables. Market volatility can make these decisions more complicated. For most long-term investors, a diversified portfolio with both growth and value exposure would be appropriate for managing the risks of shifting trends between growth and value stocks and large caps versus small caps.
This material is not a recommendation to buy or sell a financial product or to adopt an investment strategy. Investors should work with their financial professional to discuss their specific situation.
Except where otherwise indicated, the views and opinions expressed are those of Nationwide as of the date noted, are subject to change at any time and may not come to pass.
Russell 1000® Growth Index: An unmanaged index that measures the performance of the large-capitalization growth segment of the U.S. equity universe; includes those Russell 1000® Index companies with higher price-to-book ratios and higher forecasted growth values.
Russell 1000® Value Index: An unmanaged index that measures the performance of the large-capitalization value segment of the U.S. equity universe; includes those Russell 1000® Index companies with lower price-to-book ratios and lower forecasted growth values.
Russell 2000® Growth Index: An unmanaged index that measures the performance of the small-capitalization growth segment of the U.S. equity universe; includes those Russell 2000® Index companies with higher price-to-book ratios and higher forecasted growth values.
Russell 2000® Value Index: An unmanaged index that measures the performance of the small-capitalization value segment of the U.S. equity universe; includes those Russell 2000® Index companies with lower price-to-book ratios and lower forecasted growth values.
Russell Investment Group is the source and owner of the trademarks, service marks and copyrights related to the Russell Indexes. The Fund is not sponsored, endorsed, or promoted by Russell, and Russell bears no liability with respect to any such funds or securities or any index on which such funds or securities are based. Russell ® is a trademark of Russell Investment Group.
Nationwide Funds are distributed by Nationwide Fund Distributors LLC, member FINRA, Columbus, Ohio. Nationwide Investment Services Corporation, member FINRA, Columbus, Ohio.
Nationwide, the Nationwide N and Eagle and Nationwide is on your side are service marks of Nationwide Mutual Insurance Company. © 2023 Nationwide
NFN-1561AO

