

Shifts in stock market leadership can be extreme
Small caps have led the market recently, taking over from large caps. What will it take for the rally to continue?

In my weekly capital markets review, I cover the factors that have influenced market movements, share insights on stock market performance, and connect the dots on key events to watch for in the upcoming weeks.
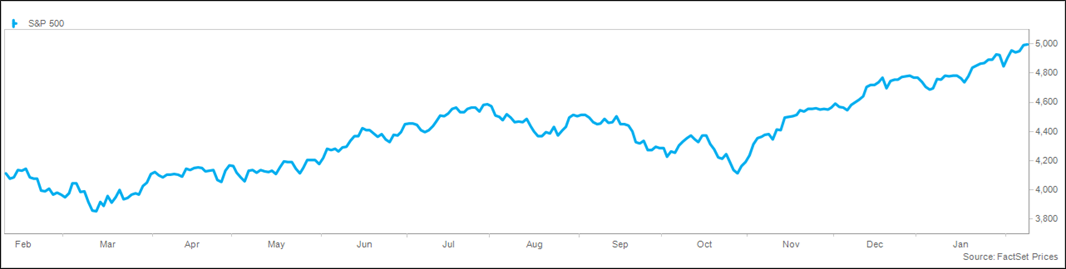
Equity markets continue their steady climb higher, with the S&P 500® Index ticking above 5,000 for the first time, tracking for the 14th gain in 15 weeks for the first time since 1972, and touching a record high in 10 of the past 16 sessions. The market has been resilient, with hawkish Fed commentary, regional banking stress, mixed earnings guidance, and geopolitical tension unable to crack the momentum. Not much news drove the weekly gain, with investors becoming gradually more comfortable with a soft landing and moderating inflation. Bond yields continued to tick higher, with the 10-year yield at a two-month high as expectations for Fed rate cuts moderate. The equity market’s strength despite changing Fed expectations and higher interest rates is notable given the sharp reactions to the Fed in recent years. A less emotional market is a positive sign, though investors must fight against the complacency that is a natural reaction to such a strong and steady bull run.
The strong momentum has brought skeptical institutional and retail investors back into the market, which has a compounding effect on the rally, though it is increasingly driving questions of sustainability. The 21% rally since last October has driven the S&P 500 to a price-to-earnings ratio of over 20x for the first time in two years. While valuations have historically proved to be a weak market timing tool, buying at lower valuations has provided stronger long-term returns. Valuations are not universally extended, however, as the performance gap between large-cap technology and the rest of the market has resulted in a stark valuation gap. The Russell 1000 Growth® Index trades at 28x earnings after a 42% return last year and an additional 8% this year. By contrast, the Russell 1000 Value® Index trades at 15x, the S&P Small Cap 600® Index trades at 14x, and the MSCI EAFE Index (developed international) trades at 14x, all roughly half of the large growth benchmark.
Earnings season has begun to slow, with more than two-thirds of the S&P 500 companies having reported. Earnings growth is tracking towards 3% with sales growth of 4%. The tone of management calls is cautiously optimistic, including increasing confidence in a soft landing in the US, a resilient consumer, some cyclical “green shoots” across the globe, and excitement around AI. With earnings season fading, we will see an acceleration in share repurchases, with Bank of America data showing the pace of buybacks is higher than the peak of 2023, and Deutsche Bank data noting the run rate has climbed to $1 trillion per year. Despite cautious guidance from many companies, the consensus estimate for 2024 has ticked higher for the first time since August, with growth expected to be 11% on 5% sales growth.
The Bureau of Labor Statistics published its annual revisions to the Consumer Price Index (CPI) on Friday, with no changes to the 3.3% annualized pace for the fourth quarter. December’s reading was revised lower to 0.2% sequentially, while core CPI was unchanged at 0.3%. This caused a relief rally in Treasuries, as it reinforces that inflation is moderating. This comes ahead of next Tuesday’s report on January CPI, with a consensus estimate of 2.9% from a year ago, with core CPI expected to be 3.8%. Other recent data reaffirm the improving inflation path, with the Manheim Used Vehicle Index down 9.2% from a year ago, the largest decline since last July. Rent increases have slowed sharply, rising at the slowest pace since 2010 last year at 0.3%, with outright declines in some geographies. Shipping companies are noting overcapacity despite supply chain pressures in the Red Sea and Panama Canal. China’s CPI fell in January for the fourth month, with prices falling at the fastest in 15 years.
Labor market data (JOLTS, monthly payrolls, unemployment claims) all reflect a strong job market, but cost-cutting and layoffs are a growing theme during earnings calls. A Challenger, Gray & Christmas report expects that cuts would continue into 2024 after already surging by 98% in 2023. Recent announcements spanned various industries, including technology, banks, media, and transportation. The fact that high-profile companies are restructuring without causing broad job market weakness reflects the unusual environment from the pandemic, where deep-pocketed companies aggressively hired, while smaller companies struggled to fill roles given the lack of labor availability and the two-to-one ratio of job openings to those looking for a job.
Markets continue to rally as the bear argument is becoming increasingly difficult to form. The S&P 500® Index gained more than 1% for the fifth straight week, while the Dow was fractionally higher and the NASDAQ jumped by 2%. Growth indexes beat value, while small caps beat large caps. Leading sectors included technology, consumer discretionary, and health care, while utilities, consumer staples, and real estate lagged. Volatility continues to be modest, with the VIX closing below 14 for the 13th straight week.
Global markets were mixed, with the MSCI EAFE Index beating the S&P 500 but the MSCI Emerging Market Index just fractionally higher. Asian markets were higher on encouraging inflation data in China, with China jumping 4% and South Korea adding 2%. Europe was mixed, with Italy and France up 1%, while Spain fell 2%. Latin America was mixed despite strong commodity prices, with Brazil up 1% and Mexico fractionally lower. The trade-weighted dollar index was slightly positive for the week and hit the highest level since November.
Commodity prices were strong this week, with the S&P Goldman Sachs Commodity Index gaining 3%. Crude prices surged 6% on rising tensions in the Middle East, while natural gas fell 11% to the lowest level since early in the pandemic on warm weather and elevated inventories. Metals prices were lower, while agricultural commodities were mixed. Interest rates were higher in reaction to the continued shift in Fed expectations. The 10-year Treasury yield surged 0.16% to a two-month high, and the 2-year yield jumped 0.10% to 4.47%, resulting in a modest reversal of the inverted yield curve. Credit spreads continue to be tighter than average and global rates were higher.
Investor confidence and positioning continue to reflect the strong market rally. The CNN Fear & Greed Index ticked into the “extreme greed” category at 78 on a scale from 0 to 100, up from 70 a week ago. The AAII Sentiment Survey showed bulls unchanged at 49%, while bears eased modestly to 23% from 25%. Equity funds and ETFs saw inflows of $6 billion for the week with $17 billion in inflows into ETFs offsetting $11 billion in outflows from mutual funds. Emerging market funds had record inflows. Bond funds saw inflows for the seventh week, adding $13 billion, led by investment grade at $12 billion. Money market funds continue to attract flows, adding $60 billion for the week, with the category eclipsing $6 trillion for the first time.
Earnings season will continue to wind down next week, with 60 members of the S&P 500 set to report. Economic data include CPI and the NFIB Small Business Index on Tuesday, retail sales and industrial production on Thursday, housing starts, PPI, and consumer sentiment on Friday.
This material is not a recommendation to buy or sell a financial product or to adopt an investment strategy. Investors should work with their financial professional to discuss their specific situation.
Except where otherwise indicated, the views and opinions expressed are those of Nationwide as of the date noted, are subject to change at any time and may not come to pass.
S&P 500® Index: An unmanaged, market capitalization-weighted index of 500 stocks of leading large-cap U.S. companies in leading industries; it gives a broad look at the U.S. equities market and those companies’ stock price performance.
S&P Goldman Sachs Commodity Index: A benchmark for investment in the commodity markets and as a measure of commodity performance over time. It is a tradable index that is readily available to market participants of the Chicago Mercantile Exchange.
S&P Small Cap 600® Index: A stock market index established by Standard & Poor’s that covers roughly the small-cap range of American stocks, using a capitalization-weighted index.
S&P Indexes are trademarks of Standard & Poor’s and have been licensed for use by Nationwide Fund Advisors. The Products are not sponsored, endorsed, sold or promoted by Standard & Poor’s and Standard & Poor’s does not make any representation regarding the advisability of investing in the Product.
Russell 1000 Growth® Index: An unmanaged index that measures the performance of the large-capitalization growth segment of the U.S. equity universe; includes those Russell 1000® Index companies with higher price-to-book ratios and higher forecasted growth values.
Russell 1000 Value® Index: An unmanaged index that measures the performance of the large-capitalization value segment of the U.S. equity universe; includes those Russell 1000® Index companies with lower price-to-book ratios and lower forecasted growth values.
Russell Investment Group is the source and owner of the trademarks, service marks and copyrights related to the Russell Indexes. The Fund is not sponsored, endorsed, or promoted by Russell, and Russell bears no liability with respect to any such funds or securities or any index on which such funds or securities are based. Russell ® is a trademark of Russell Investment Group.
MSCI EAFE® Index: An unmanaged, free float-adjusted, market capitalization-weighted index that is designed to measure the performance of large-cap and mid-cap stocks in developed markets as determined by MSCI; excludes the United States and Canada.
MSCI Emerging Markets® Index: An unmanaged, free float-adjusted, market capitalization-weighted index that is designed to measure the performance of large-cap and mid-cap stocks in emerging-country markets as determined by MSCI.
Funds are not sponsored, endorsed, or promoted by MSCI, and MSCI bears no liability with respect to any such funds or securities or any index on which such funds or securities are based.
Nationwide Funds are distributed by Nationwide Fund Distributors LLC, member FINRA, Columbus, Ohio. Nationwide Investment Services Corporation, member FINRA, Columbus, Ohio.
Nationwide, the Nationwide N and Eagle and Nationwide is on your side are service marks of Nationwide Mutual Insurance Company. © 2024 Nationwide
NFN-1587AO

