

Shifts in stock market leadership can be extreme
Small caps have led the market recently, taking over from large caps. What will it take for the rally to continue?

Key takeaways:
In my weekly capital markets review, I cover the factors that have influenced market movements, share insights on stock market performance, and connect the dots on key events to watch for in the upcoming weeks.
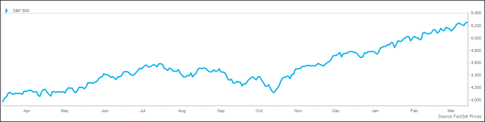
Equity markets continue their strong and steady march higher, with the S&P 500® Index positive for the second week and finishing March with a 3% gain, marking the fifth-straight positive month that saw a 26% return for the period. Leadership is beginning to broaden, with value, small caps, and developed markets all outperforming the broader market in March. The equal-weighted S&P 500 beat the market-cap-weighted index, with all 11 sectors positive. We now move on to the seasonally strong month of April, the second-best month on the calendar since 1950, with an average return of 1.5%. Bond market volatility has calmed notably in recent months, with the MOVE Index at the lowest level in more than two years.
The first quarter was outstanding, with the S&P 500® Index registering the 11th-best first quarter since 1950. In the previous 10 strong first quarters, the remainder of the year was positive in nine of those. The S&P 500 set 22 record highs in the first quarter, the third most in a first quarter on record, behind just 1964 and 1987. The strength in the quarter was broad-based, with the Russell 1000® Growth Index and the S&P 500 returning 11%, the Russell 1000® Value Index gaining 9%, the MSCI EAFE® Index adding 6%, and the Russell 2000® Index up 5%. This was the 13th back-to-back double-digit return on record for the S&P 500. In the previous 12, the remainder of the year averaged a 9% additional return, positive 83% of the time. Despite the strong and broad performance, there are few signs of complacency, with the Bank of America Bull & Bear Indicator just modestly above neutral at 5.8.
The Fed’s preferred inflation metric was in line with estimates, with the headline PCE deflator up 2.5% from a year ago, while the core PCE was up 2.8%. This marks the 36th month in a row where the core PCE deflator was above the Fed’s 2% target and is marginally higher than the 2.6% year-end estimate from the Fed’s recently released “dot plot.” Services inflation was the primary driver of the report, while durable goods were negative versus a year ago. On a sequential basis, the core PCE rose 0.3%, which when combined with the 0.5% in January marks the largest back-to-back increase in a year. The same report showed personal spending up 4.9% from a year ago, while personal income rose 4.6%, the slowest pace since November. This is the 14th straight month where real income (adjusted for inflation) was positive.
The end of the quarter begins the conversation around earnings, with the current consensus forecast for 4% earnings growth on 5% revenue growth. Negative estimate revisions during the quarter were less than average, with the average falling less than 3% since December versus an average of 4% over the past 20 years. The net profit margin is expected to be 11.6% for the quarter, modestly higher than the five-year average of 11.5%. Companies focused on the US are expected to see 2% growth, while globally focused companies are expected to grow by 7%. The largest revisions were seen in materials (-13%) and energy (-12%), per Factset. The strongest growth sectors are expected to be utilities, technology, communication services, and consumer discretionary. Growth this year is more heavily weighted towards the second half, with the full year expected to see 11% earnings growth on 4% sales growth. The earnings estimate has stabilized, flat with the level from the beginning of the year.
A week after the FOMC meeting, market participants continue to watch closely for signals of the next move. Fed Governor Waller delivered a speech that repeated his thoughts that there is no rush to cut rates, as the risk of waiting longer to ease is significantly lower than acting too soon and risking a rebound in inflation. He views it as appropriate to reduce the number of rate cuts being projected. Chair Powell hosted a panel on Friday at the Federal Reserve of San Francisco where he reiterated the themes from the recent FOMC press conference that was viewed as dovish by investors. The Fed Futures curve embeds less than three cuts this year, down from more than six at the beginning of the year.
Domestic equity markets continue their impressive march higher, with the S&P 500® Index up fractionally for the week, while the Dow was nearly 1% higher and the NASDAQ was modestly lower. Small caps significantly outperformed large caps, while value beat growth. Leading sectors for the week included utilities, real estate, and energy, while technology, communication services, and industrials lagged. Volatility remains calm, with the VIX closing the week at 13, extending the streak of weekly closes below 15 to 22 weeks. Trading volume was average.
Global markets were mixed, with the MSCI EAFE Index and MSCI Emerging Markets® Index performing roughly in line with domestic indexes. In Asia, markets were sluggish due to uncertainty around central bank policy in Japan and China, with modest declines in Japan and Hong Kong, and little change in China. European markets were higher on an incrementally dovish central bank tone, with Germany, Spain, the UK, Italy, and France all 1% higher. Latin America was strong on higher oil prices, with Mexico up 3% and Brazil up 1%. The trade-weighted dollar index was fractionally higher for the week, and is 3% higher for the year.
Interest rates have been unusually stable in recent weeks, with the 10-year Treasury yield unchanged at 4.20%. The 2-year was modestly higher at 4.62%, resulting in a slightly further inversion of the yield curve. Credit spreads were slightly wider, though they remain near the narrowest level of the cycle. Commodity prices continue to trend higher, with the S&P Goldman Sachs Commodity Index up 1% for the week and 9% to date in 2024. Crude prices jumped to the highest level since October on the belief that OPEC+ will maintain its production cuts. Natural gas prices eased on warming weather, while agricultural commodities were mixed. Gold hit a record high and is now up 8% for the year.
Investor sentiment and behavior continue to show moderate, but not excessive, optimism. Inflows into equity funds were strong at $15 billion, roughly triple the average from the past three months. ICI data showed that institutional investors withdrew $10 billion from money market funds in the latest week as investors took an incremental risk-on stance. Investor sentiment continues to be positive but not excessive, with the CNN Fear & Greed Index at 71 on a scale from 0-100, up from 67 the previous week. The AAII Sentiment Survey showed the number of bulls rise to 50% from 43% the previous week, more than double the number of bears at 22%.
Economic releases next week will focus on the labor market, including JOLTS Job Openings on Tuesday and the monthly payroll report on Friday. Other notable releases include PMI and ISM manufacturing data on Monday, durable goods on Tuesday, PMI and ISM services data on Wednesday, and consumer credit on Friday.
This material is not a recommendation to buy or sell a financial product or to adopt an investment strategy. Investors should work with their financial professional to discuss their specific situation.
Except where otherwise indicated, the views and opinions expressed are those of Nationwide as of the date noted, are subject to change at any time and may not come to pass.
Merrill Lynch Option Volatility Estimate Index (MOVE Index): A crucial gauge of interest rate volatility in the U.S. Treasury market. It is calculated from options prices, which reflect the collective expectations of market participants about future volatility.
Source BofA Merrill Lynch, used with permission. ICE BOFA MERRILL LYNCH IS LICENSING THE ICE BOFA MERRILL LYNCH INDICES “AS IS,” MAKES NO WARRANTIES REGARDING SAME, DOES NOT GUARANTEE THE SUITABILITY, QUALITY, ACCURACY, TIMELINESS, AND/OR COMPLETENESS OF THE ICE BOFA MERRILL LYNCH INDICES OR ANY DATA INCLUDED IN, RELATED TO, OR DERIVED THEREFROM, ASSUMES NO LIABILITY IN CONNECTION WITH THEIR USE, AND DOES NOT SPONSOR, ENDORSE, OR RECOMMEND ANY OF ITS PRODUCTS OR SERVICES.
Russell 1000® Growth Index: An unmanaged index that measures the performance of the large-capitalization growth segment of the U.S. equity universe; includes those Russell 1000® Index companies with higher price-to-book ratios and higher forecasted growth values.
Russell 1000® Value Index: An unmanaged index that measures the performance of the large-capitalization value segment of the U.S. equity universe; includes those Russell 1000® Index companies with lower price-to-book ratios and lower forecasted growth values.
Russell 2000® Index: An unmanaged index that measures the performance of the small-capitalization segment of the U.S. equity universe.
Russell Investment Group is the source and owner of the trademarks, service marks and copyrights related to the Russell Indexes. The Fund is not sponsored, endorsed, or promoted by Russell, and Russell bears no liability with respect to any such funds or securities or any index on which such funds or securities are based. Russell ® is a trademark of Russell Investment Group.
S&P 500® Index: An unmanaged, market capitalization-weighted index of 500 stocks of leading large-cap U.S. companies in leading industries; it gives a broad look at the U.S. equities market and those companies’ stock price performance.
S&P Goldman Sachs Commodity Index: A benchmark for investment in the commodity markets and as a measure of commodity performance over time. It is a tradable index that is readily available to market participants of the Chicago Mercantile Exchange.
S&P Indexes are trademarks of Standard & Poor’s and have been licensed for use by Nationwide Fund Advisors. The Products are not sponsored, endorsed, sold or promoted by Standard & Poor’s and Standard & Poor’s does not make any representation regarding the advisability of investing in the Product.
MSCI EAFE® Index: An unmanaged, free float-adjusted, market capitalization-weighted index that is designed to measure the performance of large-cap and mid-cap stocks in developed markets as determined by MSCI; excludes the United States and Canada.
MSCI Emerging Markets® Index: An unmanaged, free float-adjusted, market capitalization-weighted index that is designed to measure the performance of large-cap and mid-cap stocks in emerging-country markets as determined by MSCI.
Funds are not sponsored, endorsed, or promoted by MSCI, and MSCI bears no liability with respect to any such funds or securities or any index on which such funds or securities are based.
Nationwide Funds are distributed by Nationwide Fund Distributors LLC, member FINRA, Columbus, Ohio. Nationwide Investment Services Corporation, member FINRA, Columbus, Ohio.
Nationwide, the Nationwide N and Eagle and Nationwide is on your side are service marks of Nationwide Mutual Insurance Company. © 2024 Nationwide
NFN-1611AO

