

Shifts in stock market leadership can be extreme
Small caps have led the market recently, taking over from large caps. What will it take for the rally to continue?

Key takeaways:
Despite numerous economic and financial market indicators continuing to flash recession, stocks marched further into record territory last week. The S&P 500® closed above 5,200, while the Dow Jones flirted with the high-water mark of 40,000.
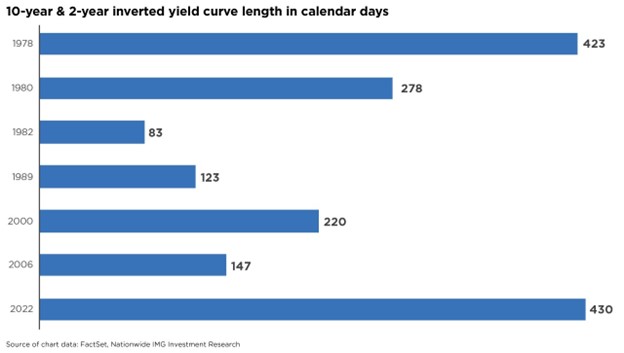
The current market cycle has defied conventional norms and time-tested signals, such as the inverted yield curve, which forewarns of a recession. The yield curve is considered inverted when interest rates on shorter-term debt securities exceed the rates on longer-term debt securities. This indicates investors are more averse to risk, fearing a recession or economic slowdown.
An inversion of the yield curve between 2-year and 10-year U.S. Treasuries has preceded every recession since 1970. As of this writing, the yield curve between 2-year and 10-year Treasuries has been inverted for 625 calendar days, the most prolonged spell on record. The last time the U.S. Treasury yield curve was inverted this long was in 1978. A recession eventually arrived in 1980.
More recently, this part of the yield curve first approached inversion at the end of March 2022. Had an investor reduced their stock exposure to zero at that point (using the S&P 500 as a proxy for stocks), they would have missed a gain of nearly 19% as of this writing. This is surely a cautionary tale on the perils of basing investment decisions on a single indicator, even a reliable one.
Likewise, the reputation of the Leading Economic Index (LEI) as a recession indicator has suffered in the current cycle. Historically, a drop of at least 5% year-over-year in the LEI occurred before a recession. The current trend in the LEI has been negative for 20 months now, at -6.3% year-over-year, but in February, it posted its first monthly increase since February 2022. Despite this historical precedent, the Federal Reserve increased its economic growth projections for 2024 from 1.4% to 2.1% at the latest FOMC meeting.
We look to historical trends and patterns in data to help us understand what the future may bring, but as the current trends show, these models have limitations. Past performance, as fund managers say, is not a guarantee of future results. So, we must weigh these different data points to determine the wide range of factors that can influence market performance. Despite the prevalence of historical data, no one has a crystal ball.
The best approach for investors is to diversify portfolio holdings to suit their risk tolerance and maintain patience with their investment strategies over a long-term time horizon.
This material is not a recommendation to buy or sell a financial product or to adopt an investment strategy. Investors should work with their financial professional to discuss their specific situation.
Except where otherwise indicated, the views and opinions expressed are those of Nationwide as of the date noted, are subject to change at any time and may not come to pass.
S&P 500® Index: An unmanaged, market capitalization-weighted index of 500 stocks of leading large-cap U.S. companies in leading industries; gives a broad look at the U.S. equities market and those companies’ stock price performance.
S&P Indexes are trademarks of Standard & Poor’s and have been licensed for use by Nationwide Fund Advisors. The Products are not sponsored, endorsed, sold or promoted by Standard & Poor’s and Standard & Poor’s does not make any representation regarding the advisability of investing in the Product.
Nationwide Funds are distributed by Nationwide Fund Distributors LLC, member FINRA, Columbus, Ohio. Nationwide Investment Services Corporation, member FINRA, Columbus, Ohio.
Nationwide, the Nationwide N and Eagle and Nationwide is on your side are service marks of Nationwide Mutual Insurance Company. © 2024 Nationwide
NFN-1607AO

