

Shifts in stock market leadership can be extreme
Small caps have led the market recently, taking over from large caps. What will it take for the rally to continue?

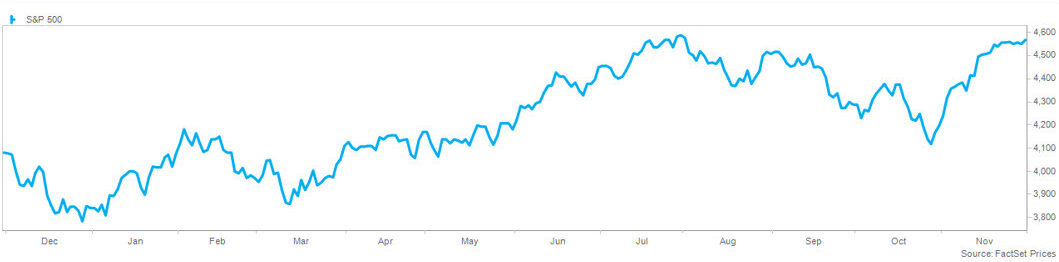
Equity markets extended their winning streak to five weeks, as the S&P 500® Index finished with a fractional gain. Investors took a breather after an impressive rally, continuing to wrestle with encouraging macro data and continued shifts in expectations for Fed policy. The S&P 500 broke through the July high and closed at the best level since January 2022. November was the sixth-best monthly return in the past 20 years and the second-best since 1980, with a 9% return for the S&P 500. The strength was broad-based, notable in growth sectors and small caps. The seasonal tailwind will continue as we transition to December. Over the past 50 years, the S&P 500 has gained 72% of the time (best month of the year), with an average gain of 1.2%.
Financial conditions continue to ease, with the Goldman Sachs Financial Conditions index improving at the best pace since last October, which led to a 20% return over the next nine months. The underlying components contribute to the improvement, including equity values, interest rates, credit spreads, and the dollar index. Investor sentiment and positioning have improved markedly, with domestic equity funds and ETFs attracting inflows for seven straight weeks, with $57 billion in November. Bank of America’s Bull & Bear Indicator has improved to 2.7 on a scale from 0 to 10. Still, it remains solidly in the “bearish” range, providing an opportunity for a continued contrarian rally. Strong seasonality, encouraging macro data, and a lack of market-moving data provide strong momentum heading into the last month of the year. Headwinds are developing for 2024, which could put pressure on earnings, though that is unlikely to derail the market in the near term.
Thursday’s inflation report encouraged investors, which showed the PCE deflator at 3.0% from a year ago, better than the 3.1% consensus and 3.4% from September. The core PCE deflator (the metric closely tracked by the Fed) was 3.5%, the best level since April of 2021. While both metrics remain well above the Fed’s 2% target, they are lower than the consensus of Fed officials for year-end according to the Summary of Economic Projections (“dot plot”) from September. The primary drivers of the gain were international travel, health care, food services, accommodations on the services side, and gasoline on the goods side.
Economic data continue to impress, with third-quarter GDP revised upwards to 5.2% from the initial reading of 4.9%, with the revision driven by nonresidential fixed investment, including structures, equipment, and intellectual property, indicating companies are willing to invest for the future despite pressure from rates. Consumer confidence was better than expectations, higher than in October after a sharp decline from July, mirroring the move in the equity market. The Atlanta Fed’s GDPNow model forecasts 1.2% growth in the fourth quarter, above the consensus of economists. Bloomberg’s recession forecast model puts the odds of a recession at 50% over the next 12 months, the lowest level in over a year, with the consensus increasingly expecting a soft landing.
Fed officials were incrementally hawkish this week, with several officials expressing uncertainty on whether they were done hiking rates. On Friday, Chair Powell said it is premature to conclude that policy is sufficiently restrictive. In contrast, Richmond President Barkin said hikes are still on the table if inflation doesn’t continue to improve, and he is not ready to discuss cuts. Fed Governor Waller was more balanced, expressing confidence in getting inflation back to the target and a willingness to discuss potentially cutting rates if that occurs. The Fed now enters a blackout period until the FOMC meeting on December 13. The Fed Futures curve maintains a distinctly dovish tilt, reflecting a 0% probability of further hikes and pricing in more than five cuts by January 2025 – this represents an increase of more than one additional cut compared to expectations at the beginning of November.
Investors continue to shift incrementally bullish as rates ease and soft-landing hopes grow, with the S&P 500® Index managing a fifth week of gains. The S&P 500 and NASDAQ gained less than 1%, while the Dow rose nearly 2%. Value indexes outperformed growth, while small caps beat large caps. Leading sectors for the week included real estate, materials, and financials, while communication services, technology, and consumer staples underperformed. Volatility continues to be extremely low, with the VIX closing below 13 for the second week, while trading volume was elevated.
Global markets were quiet this week, with the MSCI EAFE and Emerging Market Indexes both fractionally higher. In Asia, markets were mostly lower on concern over respiratory infections in China, with the Chinese market down 3% and Hong Kong down 5%, while Japan was little changed. Europe was strong on encouraging inflation data, with Germany up 2%, Spain, the U.K., Italy up 1%, and France flat. Latin America was higher on lower rates in the U.S., with Mexico and Brazil both up 2%. The trade-weighted dollar index eased further this week on lower rates, with the index down 4% since October’s high.
Commodity prices were stable following a sharp decline since September, with the S&P Goldman Sachs Commodity Index unchanged for the week and down 1% this year. Crude prices gained 1% despite a lack of clarity that OPEC+ can maintain their production cuts. Industrial and precious metals jumped, with gold up for five weeks on the outlook for FOMC rate cuts. Agricultural commodities were mixed. Interest rates continued their downward move on hopes for a soft landing and an incrementally dovish Fed, with the 10-year dropping 0.23% to 4.24%. The 2-year fell 0.36% to 4.59%, making the yield curve less inverted. Credit spreads narrowed, and global rates fell.
As mentioned, investor positioning and sentiment have been increasingly strong recently. EPFR data shows $3 billion going into equities in the latest week, driven by $8 billion going into domestic funds, offsetting international outflows. Bond funds gained for the eighth week, adding $4 billion across investment grade, high yield, and Treasuries. Money markets continue to attract assets, adding $76 billion for the week and now $1.3 trillion for the year. The CNN Fear & Greed Index was little changed at 67 on a scale from 0 to 100, while the AAII Sentiment Survey shows bulls at 49%, with the bull-bear spread at the second widest level since April 2021.
This material is not a recommendation to buy or sell a financial product or to adopt an investment strategy. Investors should work with their financial professional to discuss their specific situation.
Except where otherwise indicated, the views and opinions expressed are those of Nationwide as of the date noted, are subject to change at any time and may not come to pass.
The National Association of Active Investment Managers (NAAIM) Exposure Index is a valuable tool that helps investors gauge the sentiment of active investment managers in the stock market. The NAAIM Exposure Index shows how active risk managers have changed their clients’ accounts over the past two weeks.
S&P 500® Index: An unmanaged, market capitalization-weighted index of 500 stocks of leading large-cap U.S. companies in leading industries; it gives a broad look at the U.S. equities market and those companies’ stock price performance.
S&P Indexes are trademarks of Standard & Poor’s and have been licensed for use by Nationwide Fund Advisors. The Products are not sponsored, endorsed, sold or promoted by Standard & Poor’s and Standard & Poor’s does not make any representation regarding the advisability of investing in the Product.
Nationwide Funds are distributed by Nationwide Fund Distributors LLC, member FINRA, Columbus, Ohio. Nationwide Investment Services Corporation, member FINRA, Columbus, Ohio.
Nationwide, the Nationwide N and Eagle and Nationwide is on your side are service marks of Nationwide Mutual Insurance Company. © 2023 Nationwide
NFN-1557AO

