

Shifts in stock market leadership can be extreme
Small caps have led the market recently, taking over from large caps. What will it take for the rally to continue?

Consumer spending is the engine of the U.S. economy, so the consumer’s health matters to financial markets. This year, consumers have continued to do their part to power economic growth; retail sales rose for the fourth consecutive month in July, the fastest pace of monthly growth since January. Like our personal health, we can diagnose consumer health by examining different factors, including income prospects, debt loads, and spending patterns. Ongoing strength for employment and wages has helped sustain consumers’ moods, and moderating inflation has lessened some of the burden on household budgets. Still, other factors, such as tightening credit conditions and large economic imbalances, have made this a turbulent climate for consumers.
How can we best measure the health of U.S. consumers right now? Let’s take a holistic approach to the latest data to help assess what current consumer spending trends could mean for the markets going forward. First, credit card debt surpassed $1.0 trillion for the first time, according to the latest household debt and credit quarterly report from the Federal Reserve Bank of New York. Some analysts cited this milestone as a signal of the dire financial position for consumers, assuming that many people are using credit cards to meet their affordability needs. Optimists may argue this spending is a natural result of strong labor markets and contributes to increased business activity and economic growth. Pessimists, however, could point to the high borrowing costs consumers pay to carry these credit balances, with credit card interest rates currently averaging around 24% for people with good credit.
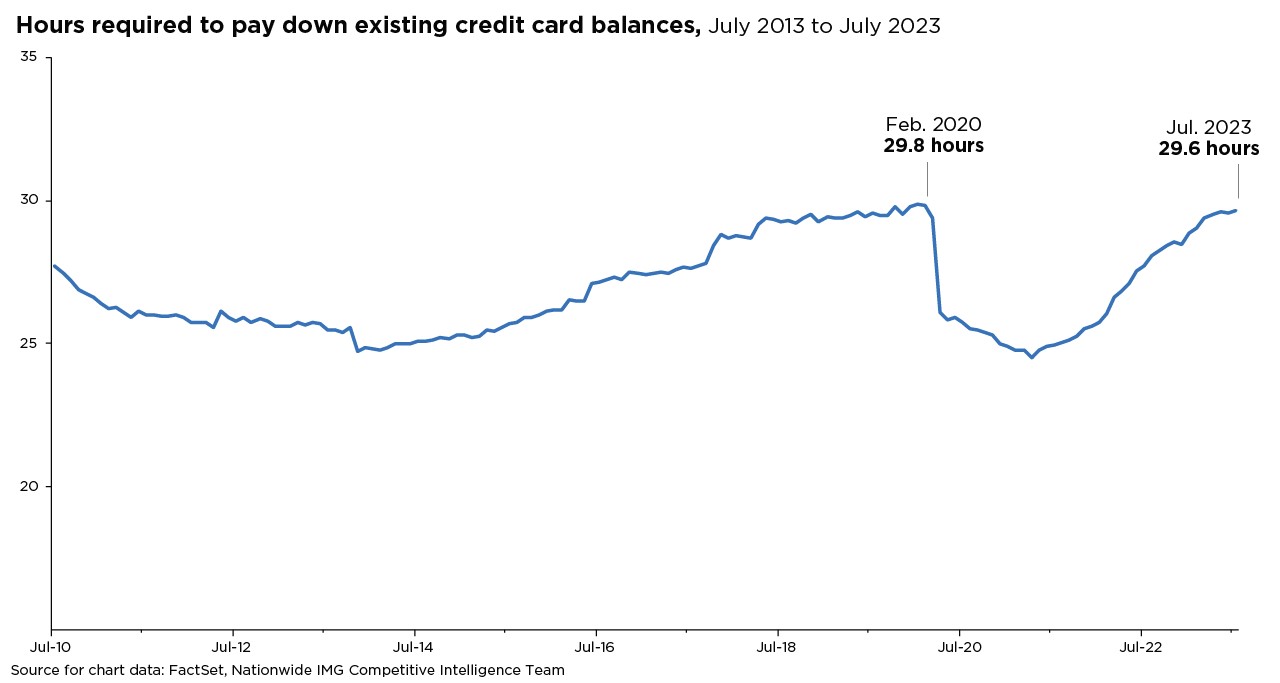
Can consumers afford to meet their debt obligations? A few more data points can help answer this question. For example, for July 2023, the average consumer would need to work around 30 hours to pay down the total amount of their credit card balance. That seems high, but when placed in a historical context (illustrated in the accompanying chart), this figure is mostly on trend for the previous decade after a brief COVID-induced dip.
Moreover, the ratio of household debt to total disposable income (as measured by the Federal Reserve’s Financial Obligations Ratio) is below its pre-COVID level at 14.3% for Q1 of 2023, which is also below its 15.9% average since 2000. That indicates consumers generally have a fair amount of ability to service their debt. On top of that, 85% of homeowners have fixed-rate mortgages, which may help blunt the impact of higher interest rates on household budgets.
As a counterpoint, the share of cardholders late on payments 30 days or more increased to 7.2% in Q2 this year, up from 6.5% in Q1. The recent figure is also the highest rate in over ten years. You might assume this increase implies consumers are feeling more stress. However, household debt payments as a percentage of disposable income fell to 9.6% in Q1, well below its pre-pandemic average. Likewise, consumer debt as a percentage of GDP has declined to levels last seen since 2001. People also appear to be saving more; the Bank of America Institute’s latest “Consumer Checkpoint” report stated that median deposit balances across all household income levels are at least 30% higher in July 2023 than they averaged in 2019.
In reading these different metrics, you could conclude that the health of the U.S. consumer appears stable, which could help bolster the overall economy through any prospective downturn. When seeking insight into the markets from economic reports, it’s important to consider a wide range of data points rather than rely on a single indicator. Investment decisions should also consider investors’ current financial picture, risk tolerance, time horizon, and other factors that make their financial plan specific for their long-term goals.
This material is not a recommendation to buy or sell a financial product or to adopt an investment strategy. Investors should discuss their specific situation with their financial professional.
Except where otherwise indicated, the views and opinions expressed are those of Nationwide as of the date noted, are subject to change at any time and may not come to pass.
Nationwide Funds are distributed by Nationwide Fund Distributors LLC, member FINRA, Columbus, Ohio. Nationwide Investment Services Corporation, member FINRA, Columbus, Ohio.
Nationwide, the Nationwide N and Eagle and Nationwide is on your side are service marks of Nationwide Mutual Insurance Company. © 2023 Nationwide
NFN-1510AO

