

Shifts in stock market leadership can be extreme
Small caps have led the market recently, taking over from large caps. What will it take for the rally to continue?

The stock market’s rally from the October 2023 low has been remarkable in several ways. For example, double-digit quarterly gains for the S&P 500® Index—11.2% for Q4 last year and 10.2% for Q1 this year—have only happened eight times since 1954. Furthermore, Q1 was the 11th-best first quarter for the S&P 500 since 1950. The index also notched 22 record highs, the third most in a first quarter on record (just trailing 1964 and 1987.)
Meanwhile, a contentious debate has persisted since the October lows about market breadth and over-concentration by mega-cap stocks, with some investors questioning the increasingly stretched sentiment and stock market valuations. Although a minor pullback or consolidation for the S&P 500 is not unwarranted—and frankly would be healthy after such a long stretch of gains—examining market breadth might offer insights into what stocks may offer going forward.
Let’s start with a definition. Market breadth refers to the number of stocks advancing versus declining within an index or sector. Investors often use market breadth to indicate the overall market’s health, as it provides insight into what’s happening beneath the surface level of the index. Higher breadth, combined with a rising value like we’ve seen in the S&P 500 as of late, indicates the rally is broad-based, suggesting the recent advance is solid and sustainable.
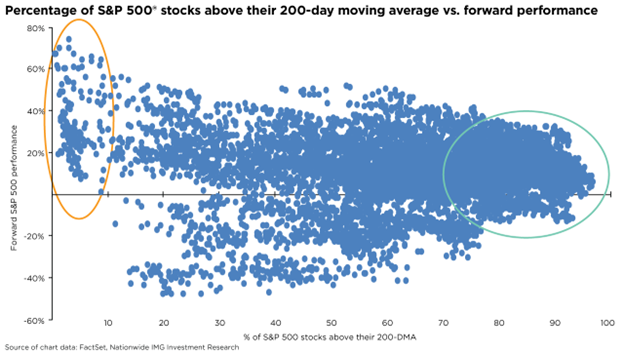
Another way to measure market breadth is to analyze the percentage of stocks trading above their 200-day moving averages (DMA). The chart illustrates the percentage of S&P 500 stocks currently trading above their 200-DMA, represented on the x-axis, and the forward 12-month price return for each breadth reading, displayed on the y-axis. Returns become more consistent and skew positive as market breadth improves (the green circle where around 70% of stocks are above their 200-DMA). Moreover, when at least 70% of stocks are trading above their 200-DMA, the forward 12-month price return averages approximately 10.4%, with close to 86% of occurrences generating positive returns.
Curiously, when market breadth is low—when less than 10% of stocks are trading above their 200-DMA—it seems to act as a contrarian signal that a market bottom might be occurring, even when returns are also positive (orange circle at left in the chart). All that said, the recent broadening of the rally implies that upside momentum should continue over the next 12 months, and long-term investors have less to fear from a minor pullback or consolidation.
This material is not a recommendation to buy or sell a financial product or to adopt an investment strategy. Investors should work with their financial professional to discuss their specific situation.
Except where otherwise indicated, the views and opinions expressed are those of Nationwide as of the date noted, are subject to change at any time and may not come to pass.
S&P 500® Index: An unmanaged, market capitalization-weighted index of 500 stocks of leading large-cap U.S. companies in leading industries; gives a broad look at the U.S. equities market and those companies’ stock price performance.
S&P Indexes are trademarks of Standard & Poor’s and have been licensed for use by Nationwide Fund Advisors. The Products are not sponsored, endorsed, sold or promoted by Standard & Poor’s and Standard & Poor’s does not make any representation regarding the advisability of investing in the Product.
Nationwide Funds are distributed by Nationwide Fund Distributors LLC, member FINRA, Columbus, Ohio. Nationwide Investment Services Corporation, member FINRA, Columbus, Ohio.
Nationwide, the Nationwide N and Eagle and Nationwide is on your side are service marks of Nationwide Mutual Insurance Company. © 2024 Nationwide
NFN-1612AO

