

Shifts in stock market leadership can be extreme
Small caps have led the market recently, taking over from large caps. What will it take for the rally to continue?

In my weekly capital markets review, I cover the factors that have influenced market movements, share insights on stock market performance, and connect the dots on key events to watch for in the upcoming weeks.
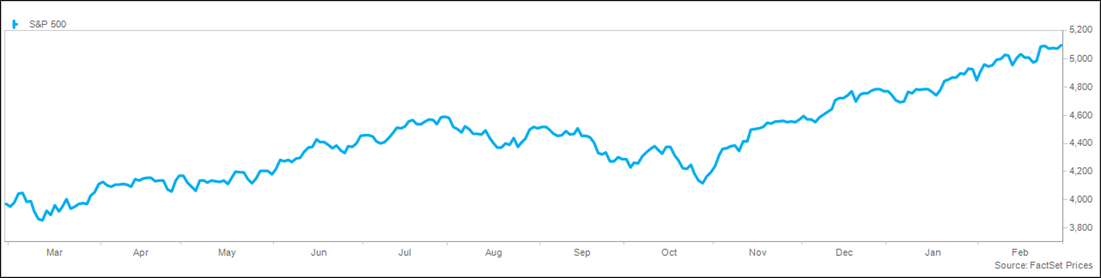
Markets closed out February strong, jumping 5% for the fourth-straight monthly gain that saw a return in the S&P 500® Index of 24%. The Index has registered 15 record closes this year and is heading for the 16th gain in 18 weeks. Leadership in February was notably broader, with the participation of small caps, value, and emerging markets. With a 7% gain in the first two months of the year, this would represent the best start to the year since 2012 and the second-best since 1998. Since 1950, there have been 22 years with a 5% or greater return through February. Additionally, the remaining year showed positive returns in 20 out of 22 years, with an average of 12%.
Investors continue to add to positions across the risk spectrum, with money market funds adding $39 billion in the latest week despite the strong performance of risk assets. The run rate for the year is tracking towards $1.4 trillion, which is slightly higher than last year’s record of $1.3 trillion. Bond funds also continue to attract flows, adding $14 billion in the week. Investment grade funds are annualizing towards $500 billion for the year, which would be nearly double the previous record high. Equity funds added $10 billion for the week, with the year-to-date trend tracking towards $500 billion, with a run rate in technology funds heading towards $100 billion, a record by nearly a factor of two. As a signal of the enhanced risk-seeking of investors, crypto funds are on pace for record flows, attracting $8 billion to date.
Inflation data continues to be a focus of investors, including this week’s PCE report (the Fed’s preferred inflation metric). Headline PCE improved to 2.4% from a year ago versus 2.6% in December, the lowest reading in nearly three years, and core PCE was 2.8%, down from 2.9% in December. Services prices were stubbornly high at 3.9%, while goods prices were down 0.5%. Services inflation is being impacted by wage pressure, as personal income jumped 1% sequentially and 4.8% from a year ago. The same report showed that consumer spending remains robust, with personal consumption expenditures up 4.5% from a year ago. The personal savings rate remains low, though it did tick higher from December at 3.8%.
The Senate passed a stop-gap spending package, sending it to President Biden for approval. The bipartisan (77-13) vote will avert a government shutdown that was set to occur on Friday. Biden said the passage was good news for Americans because it avoids a damaging shutdown, but added, “This is a short-term fix, not a long-term solution.” The bill simply moves the deadlines from the two-stage shutdown from March 1 and March 8 to March 8 and March 22 to provide more time for a long-term solution. There is a statutory requirement for a 1% sequestration after April if no deal is reached. The market has largely ignored the risk of a government shutdown or incremental fiscal slowing. The Congressional Budget Office is projecting a $500 billion improvement in the budget deficit over the next eight months, down from $2.1 trillion today to $1.6 trillion by September 30, driven by increased tax revenue on higher capital gains. Congress is in bipartisan discussions on a tax cut bill that would create $200 billion in stimulus in the first two years, largely for corporations on R&D tax credits and expensing of depreciation.
Economic data continues to be strong, with revisions to fourth quarter GDP fractionally lower at 3.2%. The Atlanta Fed’s GDPNow model is currently reflecting first-quarter growth of 2.1%, still above the long-term average. This is the second strongest level of the past two years, though it was a deceleration from 4.9%. There are modest signs of slowing in this week’s data, with disappointing new home sales, weak durable goods orders, falling consumer confidence, and ISM Manufacturing Purchasing Managers Index in contraction for the 16th straight month (including falling new orders). The Citigroup Economic Surprise Index remains strong at 41, though it has begun to trend lower.
The relentless bull market run continued this week, with the S&P 500® Index closing at a record high, adding nearly 1% for the week. The Dow was fractionally lower, while the NASDAQ jumped over 1% to a record high. Growth and value performed roughly in line, while small caps meaningfully outperformed large caps. Leading sectors for the week included consumer discretionary, technology, and energy, while health care, utilities, and consumer staples lagged. Volatility remains subdued, with the VIX closing at 13, marking the 15th time in 16 weeks that it has ended the week below 14; furthermore, the trading volume remained high throughout the week.
Global markets were mixed, with the MSCI EAFE® Index slightly higher and the MSCI Emerging Markets® Index fractionally lower. In Asia, Japan continued its strong momentum, with the Nikkei 225 breaking above 40,000 for the first time while China was little changed. In Europe, markets were mixed despite encouraging inflation data, with Germany up 2%, Italy up 1%, France and the UK slightly lower, and Spain down 1%. Latin America was mixed despite higher oil prices, with Brazil up 1% and Mexico down 1%. The trade-weighted dollar index remained largely unchanged for the week.
Interest rates eased modestly, as incrementally slowing economic data shifts worries on inflation. The 10-year Treasury yield fell 0.04% to 4.21% and the 2-year yield dropped 0.11% to 4.56%, resulting in a slight flattening of the yield curve. Credit spreads remain near the tightest of the cycle, while global rates were slightly lower. Commodity prices were higher on the outlook for global growth, with the S&P Goldman Sachs Commodity Index jumping 3%. Crude prices surged 6% to top $80 for the first time since November on word that OPEC+ is planning to cut production through the second quarter and potentially for the year. Natural gas prices jumped, while metal and agricultural commodities were mixed.
As noted, investor flows are strong and broad, with strong inflows into cash, bonds, equities, and crypto. Investor sentiment is at elevated levels, with the CNN Fear & Greed Index remaining in the “extreme greed” category at 77 on a scale from 0-100, driven by elevated market momentum, new highs versus new lows, strong breadth, a low put to call ratio, the relative performance of stocks versus bonds, and tight credit spreads. The AAII Sentiment Survey showed bulls jumping to 47% from 44% last week, while bears fell to 21% from 26%, both significantly more optimistic than the historical average.
The labor market will be the primary focus of investors next week, highlighted by the JOLTS job openings report on Wednesday and the nonfarm payroll report on Friday. Other notable data include PMI and ISM on Tuesday, the Fed’s Beige Book on Wednesday, and productivity on Thursday.
This material is not a recommendation to buy or sell a financial product or to adopt an investment strategy. Investors should work with their financial professional to discuss their specific situation.
Except where otherwise indicated, the views and opinions expressed are those of Nationwide as of the date noted, are subject to change at any time and may not come to pass.
S&P 500® Index: An unmanaged, market capitalization-weighted index of 500 stocks of leading large-cap U.S. companies in leading industries; it gives a broad look at the U.S. equities market and those companies’ stock price performance.
S&P Goldman Sachs Commodity Index: A benchmark for investment in the commodity markets and as a measure of commodity performance over time. It is a tradable index that is readily available to market participants of the Chicago Mercantile Exchange.
S&P Indexes are trademarks of Standard & Poor’s and have been licensed for use by Nationwide Fund Advisors. The Products are not sponsored, endorsed, sold or promoted by Standard & Poor’s and Standard & Poor’s does not make any representation regarding the advisability of investing in the Product.
MSCI EAFE® Index: An unmanaged, free float-adjusted, market capitalization-weighted index that is designed to measure the performance of large-cap and mid-cap stocks in developed markets as determined by MSCI; excludes the United States and Canada.
MSCI Emerging Markets® Index: An unmanaged, free float-adjusted, market capitalization-weighted index that is designed to measure the performance of large-cap and mid-cap stocks in emerging-country markets as determined by MSCI.
Funds are not sponsored, endorsed, or promoted by MSCI, and MSCI bears no liability with respect to any such funds or securities or any index on which such funds or securities are based.
Nationwide Funds are distributed by Nationwide Fund Distributors LLC, member FINRA, Columbus, Ohio. Nationwide Investment Services Corporation, member FINRA, Columbus, Ohio.
Nationwide, the Nationwide N and Eagle and Nationwide is on your side are service marks of Nationwide Mutual Insurance Company. © 2024 Nationwide
NFN-1598AO

