

Shifts in stock market leadership can be extreme
Small caps have led the market recently, taking over from large caps. What will it take for the rally to continue?

In my weekly capital markets review, I cover the factors that have influenced market movements, share insights on stock market performance, and connect the dots on key events to watch for in the upcoming weeks.
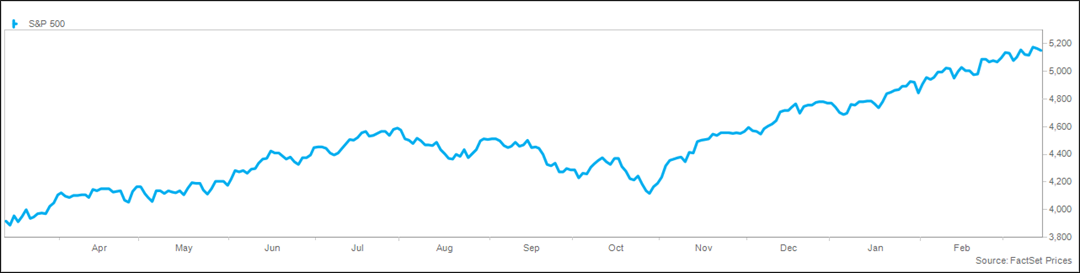
The S&P 500® Index has stalled following a hot start to the year, closing modestly lower for the second week following gains in 16 of the previous 18 weeks. Given the hotter-than-expected readings on inflation and the subsequent surge in interest rates, the modest loss confirms the level of resilience in the market. Next week’s FOMC meeting will be the next test of that resilience. While equity markets were resilient in reaction to inflation data, interest rates surged, with the 10-year Treasury yield up 0.23% to 4.31%, and the 2-year yield touching the highest level of the year at 4.72%. Friday saw some elevated volatility with quadruple witching, which occurs four times a year when stock options, index futures, index futures options, and single stock futures all simultaneously expire.
The strong performance in risk assets continues to push investors towards a risk-on posture. EPFR data showed $56 billion flowing into equity funds and ETFs in the latest week, the best level in three years, led by $7 billion into technology funds. Money markets continue to attract assets, gaining $31 billion in the latest week to drive total money market assets to a record $6.1 trillion. Interestingly, all of the gains came from retail investors, with institutional investors net sellers of money market funds for the second week. Bank of America’s Bull & Bear Indicator rose to 6.5 from 6.4 last week, thanks to strong credit technicals, equity breadth, and inflows; however, it is still below the extreme reading of 8.0.
Inflation reports this week served as a reminder that normalization is not a straight line, and pressures remain in many pockets. Tuesday’s release of the Consumer Price Index (CPI) was above expectations, with headline CPI up 3.2% versus the consensus estimate of 3.1% and 3.1% in January, while core CPI (excluding food and energy) up 3.8% versus the estimate of 3.7%. Both metrics rose 0.4% sequentially. Under the surface, core services rose 5.5% from a year ago, while core services excluding shelter rose 4.5%, reflecting the impact of strong wage gains and pricing pressure by companies. Housing remains a significant headwind, with shelter expenses up 5.7% from a year ago. The Producer Price Index (PPI) also surprised to the upside, though the numbers are far more modest, with headline PPI up 1.6% from a year ago (1.1% estimate and 1.0% in January) and core PPI up 2.0% (1.9% estimate and 2.0% in January).
The FOMC meeting next week will be closely watched, given the shift in expectations for Fed policy and recent hawkish comments from Fed officials. The Fed Futures curve currently embeds less than three cuts this year, down nearly one cut from a week ago and down three cuts since the beginning of the year. No action is expected until at least June, where the odds are roughly 50-50. This meeting comes with an update to the Summary of Economic Projections (“dot plot”), which currently embeds three cuts this year. In testimony to Congress last week, Chair Powell was encouraged by the path of inflation moderation but needs “just a bit more evidence” before cutting rates.
Economic data is beginning to soften, as highlighted by last week’s payroll report which showed an uptick in the unemployment rate, slower wage growth, and substantial downward revisions to previous months. The Atlanta Fed’s wage growth tracker was at the lowest level since December of 2021, and the Kansas City Fed Labor Market Conditions Index fell for the third straight month in February to the lowest since May of 2021. Retail sales were weaker in February, with downward revisions to previous months for the second month. Consumers have spent the pent-up savings from the pandemic, and inflation is causing a mix shift to necessities from discretionary spending. The Citigroup Economic Surprise Index remains above neutral at 29, but is down from 48 a month ago, while the Atlanta Fed’s GDPNow model now forecasts growth of just 2.3% in the first quarter, down from 3.2% expected last week.
Markets were little changed in a volatile week, with the S&P 500® Index, Dow Jones Industrial Average, and the NASDAQ all down less than 1%. Growth and value indexes performed roughly in line, while large caps beat small caps. Leading sectors for the week included energy, materials, and financials, while real estate, consumer discretionary, and health care lagged. Intraday volatility was elevated, though the VIX closed below 15 for the 20th straight week. Trading volume was elevated.
Global markets were little changed for the week, with the MSCI EAFE® Index fractionally lower, while the MSCI Emerging Markets® Index was modestly higher. In Asia, Japan was weak on the sharpest surge in wages in 30 years, falling 2%. China rallied 3% on the outlook for more government support. Europe was higher on continued strong momentum, with the Stoxx 600 index hitting a fresh record high, while France and Spain gained 2%, and Italy and Germany up 1%. Latin America was mixed despite strong oil prices, with Mexico up 3%, and Brazil 1% lower. The trade-weighted dollar index gained 1% on the inflation reports, with the index up 2% from last week.
Interest rates surged on elevated inflation data this week, with the 10-year Treasury yield jumping 0.23% to 4.31%. The 2-year yield rose 0.25% to 4.72%, resulting in a modest further inversion of the yield curve. Credit spreads remain near the tightest level of the cycle, while credit spreads jumped this week. Commodity prices jumped this week, with the S&P Goldman Sachs Commodity Index up 2%. Crude prices surged 4% to the highest level since November per reports from OPEC and the International Energy Agency both noting a tight crude market this year. Natural gas prices plummeted 6% due to warm weather, while metals prices and agricultural commodities were mostly higher.
As noted, investors continue to aggressively buy equities, with $56 billion in inflows into global equity funds and ETFs. Domestic equity funds attracted a record $56 billion, while technology funds drew $7 billion. Bond funds gained $8 billion, led by $7 billion into investment grade. The $135 billion into investment grade in the past five months is the best level in three years. Crypto funds continue to grow, adding $3 billion, while money market funds added $50 billion. Investor sentiment remains robust, with the CNN Fear & Greed Index remaining elevated at 71 on a scale from 0-100, up from 66 last week. The AAII Sentiment Survey shows the number of bulls (47%) continuing at more than double the number of bears (22%).
The FOMC meeting next week will be the primary focus of investors, potentially providing a path forward for Fed policy. Economic data is fairly light, including housing starts on Tuesday, and PMI data, existing home sales, and leading indicators on Thursday.
This material is not a recommendation to buy or sell a financial product or to adopt an investment strategy. Investors should work with their financial professional to discuss their specific situation.
Except where otherwise indicated, the views and opinions expressed are those of Nationwide as of the date noted, are subject to change at any time and may not come to pass.
S&P 500® Index: An unmanaged, market capitalization-weighted index of 500 stocks of leading large-cap U.S. companies in leading industries; it gives a broad look at the U.S. equities market and those companies’ stock price performance.
S&P Goldman Sachs Commodity Index: A benchmark for investment in the commodity markets and as a measure of commodity performance over time. It is a tradable index that is readily available to market participants of the Chicago Mercantile Exchange.
S&P Indexes are trademarks of Standard & Poor’s and have been licensed for use by Nationwide Fund Advisors. The Products are not sponsored, endorsed, sold or promoted by Standard & Poor’s and Standard & Poor’s does not make any representation regarding the advisability of investing in the Product.
MSCI EAFE® Index: An unmanaged, free float-adjusted, market capitalization-weighted index that is designed to measure the performance of large-cap and mid-cap stocks in developed markets as determined by MSCI; excludes the United States and Canada.
MSCI Emerging Markets® Index: An unmanaged, free float-adjusted, market capitalization-weighted index that is designed to measure the performance of large-cap and mid-cap stocks in emerging-country markets as determined by MSCI.
Funds are not sponsored, endorsed, or promoted by MSCI, and MSCI bears no liability with respect to any such funds or securities or any index on which such funds or securities are based.
Nationwide Funds are distributed by Nationwide Fund Distributors LLC, member FINRA, Columbus, Ohio. Nationwide Investment Services Corporation, member FINRA, Columbus, Ohio.
Nationwide, the Nationwide N and Eagle and Nationwide is on your side are service marks of Nationwide Mutual Insurance Company. © 2024 Nationwide
NFN-1604AO

