

Shifts in stock market leadership can be extreme
Small caps have led the market recently, taking over from large caps. What will it take for the rally to continue?

In my weekly capital markets review, I cover the factors that have influenced market movements, share insights on stock market performance, and connect the dots on key events to watch for in the upcoming weeks.
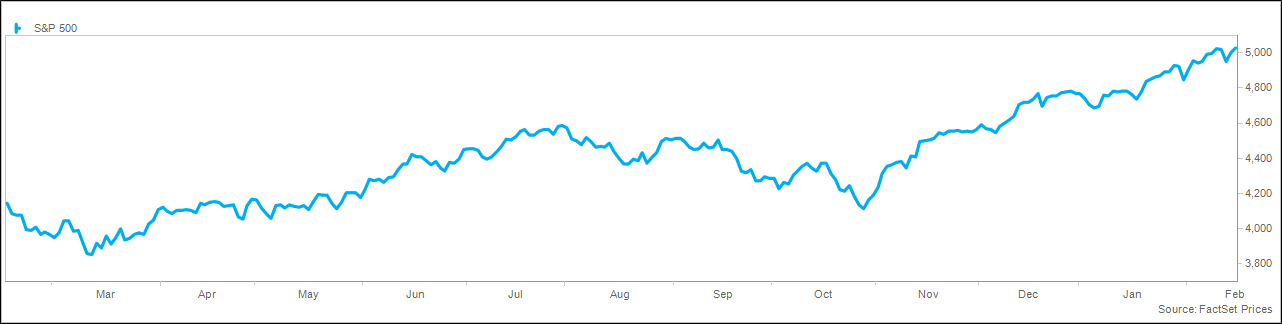
The impressive market rally paused this week on hotter-than-expected inflation data, with the S&P 500® Index falling for the first time in six weeks and just the second time in 16 weeks. Investors are operating with a “buy the dip” mentality, with Tuesday’s sharp drop due to the CPI report followed by a strong recovery on Wednesday and Thursday to the 12th record high this year. The market’s tone shifted, with small caps gaining more than 2% for the week following a sluggish start to the year. This is a welcome change, given that the top five stocks in the S&P 500 have accounted for 75% of the gain, per Bank of America, and the performance gap between the market-weighted and equal-weighted S&P 500 is at the widest since 2009. Markets may take a well-deserved breather following a staggering rally since October. However, the lack of emotional reaction to elevated inflation readings and shifting Fed expectations reflect investors’ optimism. This will likely mute any downside pressure.
Investors continue to pour money into equities, with funds and ETFs showing $11 billion of inflows in the latest week, the best in seven weeks, and the four-week total of $60 billion since February 2022. Also, $18 billion flowed out of money markets (the most in eight weeks), suggesting investors are using their “dry powder.” Corporate share repurchases are another net source of buying, with Deutsche Bank noting $130 billion in buyback announcements in the last three weeks and Goldman Sachs noting a record February for buyback announcements and purchases.
We were reminded that inflation normalization is not guaranteed or a straight line. The Consumer Price Index (CPI) rose 0.3% in January versus December, the fastest pace in four months, above the 0.2% the previous month and the 0.2% consensus. Compared with a year ago, the pace was 3.1%, below the 3.4% pace in December but above the 2.9% consensus. Excluding the volatile food and energy categories, core CPI was also above expectations at 0.4% sequentially and 3.9% from a year ago. The upside was driven by transportation (insurance and airfare), medical care, and education. Housing also remains a headwind, with the calculation of owners’ equivalent rent still well above observed rent increases. On Friday, the PPI report reinforced inflationary concerns, rising a faster-than-expected 0.9% from a year ago (though slower than 1.0% in December), with core PPI up 2.0% versus the 1.8% consensus and 1.7% in December.
Hot inflation and hawkish Fed commentary rapidly shifted expectations for Fed policy. Following the PPI report, the Fed Futures curve embeds only three rate cuts this year, with the expected Fed Funds rate implied by the market higher than the Fed’s “dot plot” for the first time this cycle. Atlanta Fed President Bostic gave a speech noting progress on inflation but said he is still determining if we are heading to the 2% target, highlighting strong economic growth, the healthy labor market, and accelerating business optimism.
According to Bank of America’s Global Fund Manager Survey, fund managers continue to shift towards bullish positioning, with global growth expectations at a two-year high and respondents predicting no recession for the first time since April 2022. Cash levels are down to 4.2%, historically leading to an equity rally of 4% over the following three months. Global equity allocations are the highest in two years, while domestic stock allocations are the highest since November 2021. The most crowded trade remains “long Magnificent 7,” while inflation has overtaken geopolitics as the largest risk. This optimism is being echoed by Wall Street strategists, with Goldman Sachs, RBC Capital Markets, and UBS all recently raising their year-end S&P 500 price targets.
Equity markets were little changed despite some disruptive inflation news, with the S&P 500® Index down fractionally, the NASDAQ down 1%, and the Dow slightly higher. Small caps solidly outperformed large caps, while value indexes handily beat growth. Leading sectors for the week included energy, materials, and financials, while technology, communication services, and consumer discretionary lagged. Volatility remains remarkably calm, with the VIX closing below 14 for the 14th straight month, while trading volume was average.
Global markets rallied as the equity market rally broadened, with the MSCI EAFE® and MSCI Emerging Markets® Indexes outperforming the S&P 500. In Asia, Japan’s Nikkei 223 surged to a record level on the prospect of central bank accommodation, while China added 3% and Hong Kong gained 2%. Europe was also strong, with the Europe Stoxx 600 in record territory, aided by 2% gains in the UK and Italy and 1% in France and Germany. Despite the rally in oil prices, Latin America was little changed, with Brazil fractionally higher and Mexico slightly lower. The trade-weighted dollar index was modestly higher, bringing the year-to-date gain to 3% and roughly flat versus a year ago.
Interest rates surged in reaction to the inflation reports, with the 10-year Treasury yield jumping 0.13% to 4.30%, touching the highest level since November. The 2-year yield rose 0.19% to 4.67%, driving the yield curve further into inversion. Credit spreads tightened to the lowest level in over two years, with commercial paper and bank-to-bank lending yields at historically low levels. Commodity prices eased modestly, with the S&P Goldman Sachs Commodity Index dripping less than 1%. Since November, crude prices have jumped to the highest level at $78, as Middle East tensions outweigh concerns over global demand. Metals prices were mixed, while agricultural commodities were mainly lower.
Investor sentiment and positioning continue to shift towards risk-on, with the CNN Fear & Greed Index into an “extreme greed” reading at 76 on a scale from 0-100. The AAII Sentiment Survey saw bulls decrease to 42% from 49% last week, though they remain above the historical average of 38%. Bears rose to 27% from 23% but below the long-term average of 31%. As noted, fund flows continue to go towards equities, with $16 billion into equities in the latest week, driven by the US. Europe has seen outflows for seven weeks while emerging markets have seen inflows for 11 weeks. Bond funds attracted $12 billion, driven by investment grade, while money markets lost $18 billion.
The holiday-shortened week ahead is light on economic data, including leading indicators on Tuesday and PMI data and existing home sales on Thursday. The minutes from the recent FOMC meeting will be released on Wednesday.
This material is not a recommendation to buy or sell a financial product or to adopt an investment strategy. Investors should work with their financial professional to discuss their specific situation.
Except where otherwise indicated, the views and opinions expressed are those of Nationwide as of the date noted, are subject to change at any time and may not come to pass.
S&P 500® Index: An unmanaged, market capitalization-weighted index of 500 stocks of leading large-cap U.S. companies in leading industries; it gives a broad look at the U.S. equities market and those companies’ stock price performance.
S&P Goldman Sachs Commodity Index: A benchmark for investment in the commodity markets and as a measure of commodity performance over time. It is a tradable index that is readily available to market participants of the Chicago Mercantile Exchange.
S&P Indexes are trademarks of Standard & Poor’s and have been licensed for use by Nationwide Fund Advisors. The Products are not sponsored, endorsed, sold or promoted by Standard & Poor’s and Standard & Poor’s does not make any representation regarding the advisability of investing in the Product.
MSCI EAFE® Index: An unmanaged, free float-adjusted, market capitalization-weighted index that is designed to measure the performance of large-cap and mid-cap stocks in developed markets as determined by MSCI; excludes the United States and Canada.
MSCI Emerging Markets® Index: An unmanaged, free float-adjusted, market capitalization-weighted index that is designed to measure the performance of large-cap and mid-cap stocks in emerging-country markets as determined by MSCI.
Funds are not sponsored, endorsed, or promoted by MSCI, and MSCI bears no liability with respect to any such funds or securities or any index on which such funds or securities are based.
Nationwide Funds are distributed by Nationwide Fund Distributors LLC, member FINRA, Columbus, Ohio. Nationwide Investment Services Corporation, member FINRA, Columbus, Ohio.
Nationwide, the Nationwide N and Eagle and Nationwide is on your side are service marks of Nationwide Mutual Insurance Company. © 2024 Nationwide
NFN-1591AO

