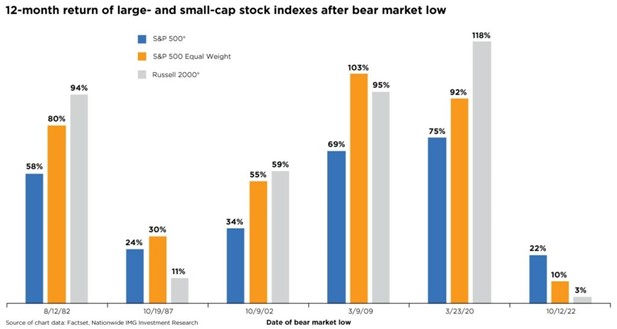
Capital Market Impact

Markets weak as investors are unimpressed by earnings beats

October 30, 2023
A man analyzing data.

Thoughts

  • Markets have resumed their downward trajectory, as surging rates, surprisingly strong economic data, inflation concerns, and a tepid reaction to earnings have combined to drive the S&P 500® Index to the lowest level since May. With two market days remaining in October, the S&P 500 seems set for the third straight negative month following five positive months. While the S&P 500 has returned 9%, many indexes are negative for the year, including the Russell 2000® Index (small caps) down 5%, the Russell 1000® Value Index down 4%, and the Dow down fractionally. The Magnificent Seven (Apple, Amazon, Microsoft, Meta, Alphabet, Nvidia, and Tesla), which have driven the market return to date are beginning to show signs of strain, collectively trading at the weakest level since May.
  • The FOMC is set to meet this week amid tremendous economic and rate uncertainty. The meeting has garnered little attention, as the Fed Futures curve embeds 0% chance of a hike and less than one-third chance of any more hikes this cycle. Also on Wednesday, the Treasury will announce its quarterly refunding plan, which will likely reflect a ramp-up in sales given the level of the deficit. This incremental buyer for this surge in supply is uncertain, as quantitative tightening and sluggish foreign interest weigh on rates. Interest rates continued their march higher, with the 10-year Treasury yield briefly breaching 5% for the first time since 2007.
  • The behavior of the market feels different now, and my cautious optimism has now been tempered because of activity over the past few weeks. Last week ended 2% down, which is the fifth one since the market peaked in July. We broke through 4,200 for the S&P 500 and hit above 5% for the 10-year treasury, which are psychologically important milestones for investors. And we’re starting to see end of 2023 and 2024 earnings estimates begin to tick lower than before, which is particularly notable since last week was earnings for Big Tech names. If these companies break down, it’ll be very hard for the market to recover.
  • In conjunction with this shift in markets, we also passed the one-year anniversary of the current bull market earlier this month. In reviewing historical stock data, the 22% return of the current bull market is the weakest 12-month return for a new bull market since 1950. In the 12 months following previous bear market lows, returns have averaged 39%. Investors will need to combine a long-term investment plan with historical insights to better navigate shifting economic and market headwinds. See the chart below for additional context.

Chart of stock indexes after bear market low.

10/30/23

News

  • Economic data continues to surprise to the upside, with third-quarter GDP growth of 4.9%, ahead of the 3.8% consensus estimate and the fastest pace since the fourth quarter of 2021. The eye-popping increase was driven by consumer spending (up 4% for the quarter), increased inventories, exports, residential investment, and government spending. Also reported on Thursday, durable goods surged in September to the best level since July 2020. In the typical “good news is bad news reaction,” markets sold off on thoughts that the report could take the Fed off the sidelines and result in additional rate hikes. Growth is expected to sharply decelerate in the fourth quarter, with an estimate of just 0.3%, followed by 0.0% in the first quarter of 2024. This was echoed this week by cautious macro comments from UPS, Tesla, and Visa in their disappointing forward earnings guidance. Friday’s report on the consumer showed the headline PCE deflator in line with expectations and the previous month at 3.4% and the core PCE deflator (the Fed’s preferred inflation metric) down slightly at 3.7%. Personal spending jumped 5.9% from a year ago, while personal income rose 4.7%, suggesting strong real wage growth.
  • Earnings season has delivered mixed messages as we approach the mid-point, with consistent beats teamed with cautious guidance. The market reaction is far from mixed, with misses getting punished and beats resulting in little reward, with S&P 500 companies beating earnings seeing a 1% average decline in stock price in the two days before and three days after reporting. There is a clear difference between the growth of domestically focused sectors showing strong growth (communication services +42%, consumer discretionary +33%, and financials +16%). In comparison, globally oriented sectors struggle (energy -38%, materials -21%, and health care -19%) due to the economic growth disparity and strength of the dollar. Cautious guidance has weighed on fourth-quarter estimates, with 5% growth now forecast versus 8% coming into earnings season. The estimate for 2024 is also trending modestly lower.

What to Watch

  • Earnings season has its last major week before ceasing to be the primary focus of investors, with nearly one-third of S&P 500 companies set to report. Economic data include consumer confidence on Tuesday, JOLTS job openings on Wednesday, durable goods on Thursday, and the monthly payroll report on Friday. The FOMC meets Wednesday.

Sources/Disclaimer

  • This material is not a recommendation to buy or sell a financial product or to adopt an investment strategy. Investors should discuss their specific situation with their financial professional.

    S&P 500® Index: An unmanaged, market capitalization-weighted index of 500 stocks of leading large-cap U.S. companies in leading industries; gives a broad look at the U.S. equities market and those companies’ stock price performance.

    S&P Indexes are trademarks of Standard & Poor’s and have been licensed for use by Nationwide Fund Advisors.  The Products are not sponsored, endorsed, sold or promoted by Standard & Poor’s and Standard & Poor’s does not make any representation regarding the advisability of investing in the Product.

    Russell 2000® Growth Index: An unmanaged index that measures the performance of the small-capitalization growth segment of the U.S. equity universe; includes those Russell 2000® Index companies with higher price-to-book ratios and higher forecasted growth values.

    Russell 1000® Value Index: An unmanaged index that measures the performance of the large-capitalization value segment of the U.S. equity universe; includes those Russell 1000® Index companies with lower price-to-book ratios and lower forecasted growth values.

    Russell Investment Group is the source and owner of the trademarks, service marks and copyrights related to the Russell Indexes. The Fund is not sponsored, endorsed, or promoted by Russell, and Russell bears no liability with respect to any such funds or securities or any index on which such funds or securities are based. Russell ® is a trademark of Russell Investment Group.

    Nationwide Funds distributed by Nationwide Fund Distributors LLC (NFD), member FINRA, Columbus, Ohio. NFD is not affiliated with any subadviser contracted by Nationwide Fund Advisors, with the exception of Nationwide Asset Management, LLC.  Nationwide Investment Services Corporation, member FINRA, Columbus, Ohio.

    Nationwide, the Nationwide N and Eagle, and Nationwide is on your side are service marks of Nationwide Mutual Insurance Company. © 2023 Nationwide

MFN-0893AO