

Shifts in stock market leadership can be extreme
Small caps have led the market recently, taking over from large caps. What will it take for the rally to continue?

The recent easing in stock market volatility, as indicated by the downward trend of the CBOE Volatility Index (VIX), may be perplexing or frustrating to some investors, depending on their views. Given the macroeconomic backdrop, the market’s calm spell (although with a slow climb) may seem puzzling, but it looks like what traders call a “coiled spring.” A coiled-spring market has a high potential for solid movement in one direction after a long stagnant spell or a significant shift in the opposite direction. And the S&P 500® Index’s narrow trading range between 3800-4200 seems stale for some time.
In contrast, the current surge in the NASDAQ® Composite Index raises concerns about the long-term sustainability of the tech-driven rally. As of year-to-date, the Nasdaq has outpaced the Dow Jones Industrial Average® Index by approximately 20%, the most significant gap in performance between the two indexes in over 30 years. Likewise, the Nasdaq has outperformed the S&P 500 by about 11% year-to-date. However, just a few stocks – primarily the technology behemoths most investors are familiar with – are powering these returns. That’s problematic and, like a coiled spring, creates the potential for a negative reversal in the Nasdaq.
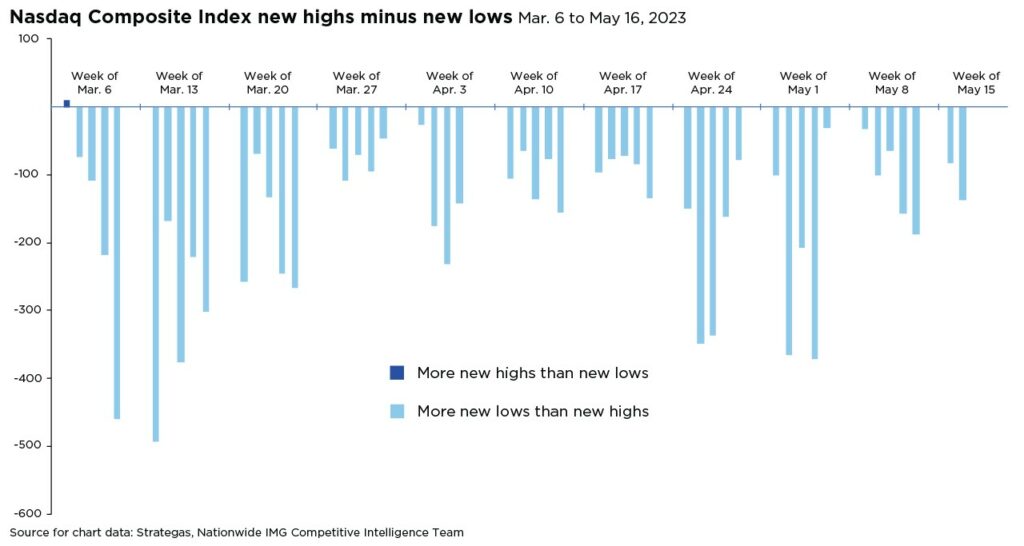
This limited leadership in performance and the lack of market breadth have defined the stock market in 2023 thus far. While the headlines trumpet tech-driven index returns, something else is happening beneath the surface. For example, as of May 16, the Nasdaq had gone 50 consecutive days with more new lows than new highs. Despite this, the NASDAQ 100® Index (which tracks the 100 most significant Nasdaq stocks) finished higher that day, and the S&P 500 Tech sector closed at its highest level relative to the S&P 500 since March 2000.
It’s a bifurcated market, and investors should pay attention to the underlying factors driving the market’s upward trends and the indicators countering the prevailing narrative. Investors can benefit from these technical insights to make informed allocation decisions and position their portfolios for the market’s future direction.
This material is not a recommendation to buy or sell a financial product or to adopt an investment strategy. Investors should discuss their specific situation with their financial professional.
Except where otherwise indicated, the views and opinions expressed are those of Nationwide as of the date noted, are subject to change at any time and may not come to pass.
S&P 500® Index: An unmanaged, market capitalization-weighted index of 500 stocks of leading large-cap U.S. companies in leading industries; gives a broad look at the U.S. equities market and those companies’ stock price performance.
S&P Indexes are trademarks of Standard & Poor’s and have been licensed for use by Nationwide Fund Advisors LLC. The Products are not sponsored, endorsed, sold or promoted by Standard & Poor’s and Standard & Poor’s does not make any representation regarding the advisability of investing in the Product.
NASDAQ® Composite Index: A stock market index of the common stocks and similar securities (e.g. ADRs, tracking stocks, limited partnership interests) listed on the NASDAQ stock market.
NASDAQ 100® Index: A rules-based, market capitalization-weighted index of the 100 largest, most actively traded U.S. companies listed on the NASDAQ stock exchange.
Dow Jones Industrial Average® Index: a stock market index of 30 prominent companies listed on stock exchanges in the United States.
Nationwide Funds are distributed by Nationwide Fund Distributors LLC, member FINRA, Columbus, Ohio. Nationwide Investment Services Corporation, member FINRA, Columbus, Ohio.
Nationwide, the Nationwide N and Eagle and Nationwide is on your side are service marks of Nationwide Mutual Insurance Company. © 2023 Nationwide
NFN-1465AO

