

Shifts in stock market leadership can be extreme
Small caps have led the market recently, taking over from large caps. What will it take for the rally to continue?

Key takeaways:
One of the timelier narratives about the performance of U.S. equities is the perceived narrowness of recent market gains, such as the select few “Magnificent 7” mega-cap tech stocks that have powered the S&P 500® Index to its recent record highs.
The S&P 500, which most investors are familiar with and commonly used as a benchmark for stock market performance, is a market capitalization (cap) weighted index. That means the biggest companies by value (or market cap) have the biggest sway on performance. For example, the largest S&P 500 component, Microsoft, has a market cap of over $3.1 trillion and represents over 7.18% of the S&P 500.
On the opposite end is Hasbro, Inc., with a negligible Index weighting of only 0.2% and a market cap of just $6.9 billion (or 0.22% of Microsoft’s market cap). If both stocks go up 1% on any given day, Microsoft’s gain will have a bigger impact on the S&P 500’s daily return than Hasbro, Inc. As a result, companies with higher market caps don’t dominate sector weightings or index returns—a critical difference.
The “Mag 7” stocks have a market cap of over $12 trillion, or 30% of the S&P 500. So, what happens with these seven stocks, individually or collectively, has a big influence on the S&P 500’s performance and can skew investor perceptions of the stock market’s performance.
This skew becomes apparent when we examine all S&P 500 stocks equally. Fortunately, there’s an index for that—the S&P 500 Equal Weight Index—where the performance of the smallest firm contributes as much as the largest firm. As a result, companies with higher market caps don’t dominate sector weightings or index returns—a critical difference.
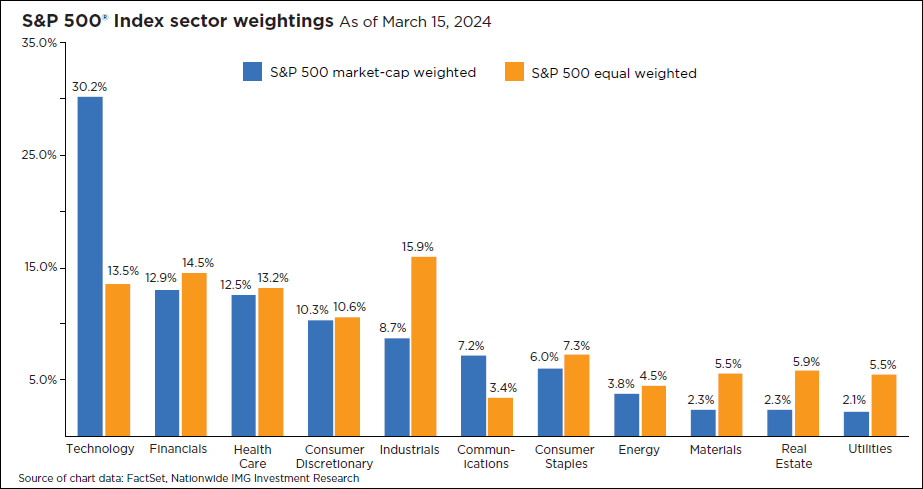
As the accompanying chart illustrates, sector weightings in the cap-weighted S&P 500 range from 30.2% for technology to 2.1% for utilities. The range is narrower for the equal weight S&P 500, from 16% for industrials to 3.6% for communications.
So, the equal weight S&P 500 significantly underweights the performance of technology and communication stocks compared to the cap-weighted S&P 500. This divergence in sector exposure implies that the equal weight index, contrary to common belief, is neutral, as its name suggests. Instead, it makes implicit sector “bets.”
Investors should avoid oversimplifying the market. Relying solely on popular narratives or if a few companies (like the “Magnificent 7”) drive all market returns can be misleading. Even when equally weighting each company, the equal weight S&P 500 still shows biases toward specific sectors compared to the traditional cap-weighted S&P 500. To make informed decisions about portfolio construction and asset allocation, it’s essential to dig deeper into the nuances of different market indexes and understand sector contributions.
This material is not a recommendation to buy or sell a financial product or to adopt an investment strategy. Investors should work with their financial professional to discuss their specific situation.
Except where otherwise indicated, the views and opinions expressed are those of Nationwide as of the date noted, are subject to change at any time and may not come to pass.
S&P 500® Index: An unmanaged, market capitalization-weighted index of 500 stocks of leading large-cap U.S. companies in leading industries; gives a broad look at the U.S. equities market and those companies’ stock price performance.
S&P 500® Equal Weight Index (EWI) is the equal-weight version of the widely-used S&P 500. The Index includes the same constituents as the capitalization weighted S&P 500, but each company in the S&P 500 EWI is allocated a fixed weight – or 0.2% of the Index total at each quarterly rebalance.
S&P Indexes are trademarks of Standard & Poor’s and have been licensed for use by Nationwide Fund Advisors. The Products are not sponsored, endorsed, sold or promoted by Standard & Poor’s and Standard & Poor’s does not make any representation regarding the advisability of investing in the Product.
Nationwide Funds are distributed by Nationwide Fund Distributors LLC, member FINRA, Columbus, Ohio. Nationwide Investment Services Corporation, member FINRA, Columbus, Ohio.
Nationwide, the Nationwide N and Eagle and Nationwide is on your side are service marks of Nationwide Mutual Insurance Company. © 2024 Nationwide
NFN-1602AO

