

Shifts in stock market leadership can be extreme
Small caps have led the market recently, taking over from large caps. What will it take for the rally to continue?

When considering small-cap stocks, it can be challenging to distinguish between signal and noise. For example, as of the end of April, the Nasdaq-100® Index (a bell weather gauge of large technology stocks) was up 21%. The Russell 2000® Index (which tracks small-cap stock performance) was up only 0.44%. This level of outperformance by large-cap tech over small-caps has only occurred a few times.
Are the Russell 2000’s weak returns a sign of slowing economic growth, or is the recent underperformance of small caps reflecting investor sentiment about current market opportunities? It can be hard to discern whether long-term trends drive recent market movements or short-term fluctuations because of external factors. Although recent performance and current valuations for small-cap stocks may warrant caution, investors who can see through the current economic weakness might be rewarded for taking a longer-term view.
The valuation gap between small and large caps is just as notable as the gap in year-to-date performance. As of this writing, the 12-month trailing price/earnings ratio for the Russell 2000 has decreased to 10.6-times earnings, falling from 18-times earnings at the start of the year. In comparison, the S&P 500® Index has only decreased from 20-times earnings to 19.8-times earnings over the same period.
Several factors could be at work here. First, recent small-cap returns may indicate a belief that an upcoming recession could be more pernicious than anticipated. Typically, small-cap companies are more vulnerable to weakening economic conditions. Second, the uncertainty around regional banks may drag small-cap performance because financials account for approximately 14% of the Russell 2000 Index weighting. Lastly, small-cap firms may face increased financing costs due to higher interest rates, and lower-quality companies may need help accessing capital markets during tighter credit conditions.
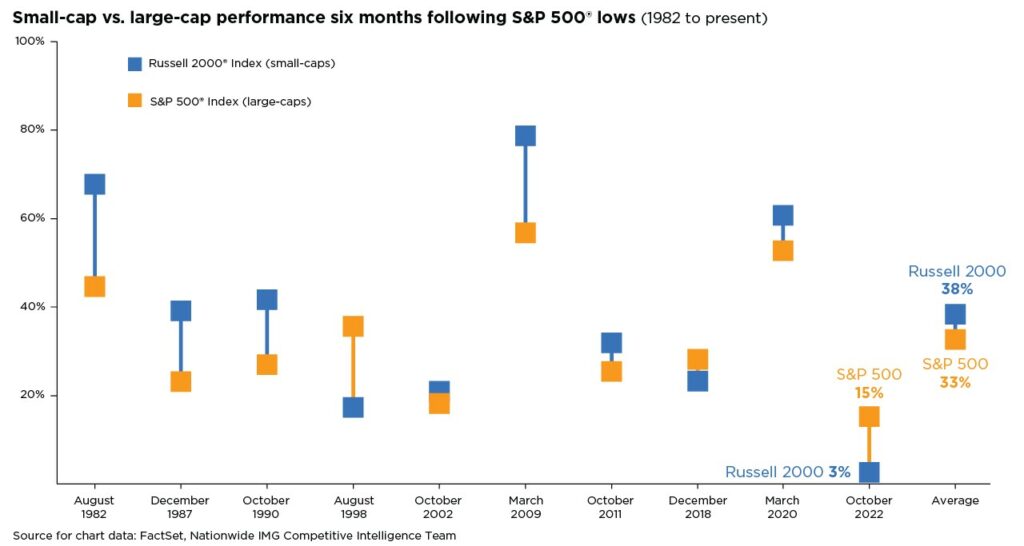
A contrarian perspective might argue that small caps have already priced in most of the looming economic contraction, and valuations relative to large caps are very attractive. Many investors believe small-cap stocks need to rally for a new bull market to emerge. As the accompanying chart shows, small-caps often (but not always) lead the way higher after the market bottoms and the economic cycle starts to improve. Investors should refrain from trying to time the turnaround for small-cap stocks but rather incorporate the asset class as suitable for their risk tolerance to participate in long-term opportunities for growth.
This material is not a recommendation to buy or sell a financial product or to adopt an investment strategy. Investors should discuss their specific situation with their financial professional.
Except where otherwise indicated, the views and opinions expressed are those of Nationwide as of the date noted, are subject to change at any time and may not come to pass.
Russell 2000® Growth Index: An unmanaged index that measures the performance of the small-capitalization growth segment of the U.S. equity universe; includes those Russell 2000® Index companies with higher price-to-book ratios and higher forecasted growth values.
Russell Investment Group is the source and owner of the trademarks, service marks and copyrights related to the Russell Indexes. The Fund is not sponsored, endorsed, or promoted by Russell, and Russell bears no liability with respect to any such funds or securities or any index on which such funds or securities are based. Russell ® is a trademark of Russell Investment Group.
S&P 500® Index: An unmanaged, market capitalization-weighted index of 500 stocks of leading large-cap U.S. companies in leading industries; gives a broad look at the U.S. equities market and those companies’ stock price performance.
S&P Indexes are trademarks of Standard & Poor’s and have been licensed for use by Nationwide Fund Advisors LLC. The Products are not sponsored, endorsed, sold or promoted by Standard & Poor’s and Standard & Poor’s does not make any representation regarding the advisability of investing in the Product.
NASDAQ-100 Index: A rules-based, market capitalization-weighted index of the 100 largest, most actively traded U.S. companies listed on the NASDAQ stock exchange.
Nationwide Funds are distributed by Nationwide Fund Distributors LLC, member FINRA, Columbus, Ohio. Nationwide Investment Services Corporation, member FINRA, Columbus, Ohio.
Nationwide, the Nationwide N and Eagle and Nationwide is on your side are service marks of Nationwide Mutual Insurance Company. © 2023 Nationwide
NFN-1459AO

