

Shifts in stock market leadership can be extreme
Small caps have led the market recently, taking over from large caps. What will it take for the rally to continue?

In my weekly capital markets review, I cover the factors that have influenced market movements, share insights on stock market performance, and connect the dots on key events to watch for in the upcoming weeks.
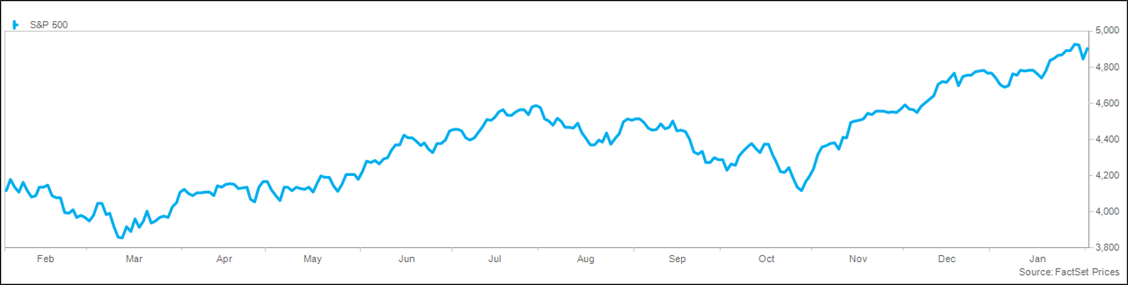
Equity markets have started the year on a positive note, with the S&P 500® Index returning 1.7% in January and looking to close higher for the 13th time in 14 weeks, the first such streak since 1986. Since 1950, when January is higher by more than 1%, the rest of the year has been positive 85% of the time, by an average of 13%. Technology continues to lead, with the Magnificent 7 now accounting for 45% of the S&P 500 and a market cap of nearly $13 trillion. Following the surge of economic, earnings, and Fed data this week, the calendar is notably lighter in the coming weeks, with the market potentially lacking a catalyst. Investors remaining on the sidelines are beginning to capitulate, which when paired with the return of share repurchases following earnings season, should act as a tailwind for markets.
The strong market is a double-edged sword, with the positive momentum helping the technical backdrop and disincentivizing short sellers, though expectations are elevated as measured by sentiment and valuations. Goldman Sachs data shows that the 20% rally over the past three months places the S&P 500 in the 99th percentile in history. Deutsche Bank data showed equity positioning at a six-month high and discretionary positioning in the 87th percentile of observations. Most sentiment remains strong but not extreme, including CNN Fear & Greed and Bank of America Bull & Bear. Valuations are elevated, particularly when compared with bond yields, with the equity risk premium (S&P 500 earnings yield versus the 3-month T-bill yield) at a 23-year low per Bank of America.
The economy continues to surprise to the upside, with payroll growth of 353,000 in January, roughly double the 177,000 estimate and well above the 216,000 in December, with 212,000 positive revisions to previous months. Strength was seen in professional and business services, health care, retail trade, and social assistance, while results were weak in the mining, quarrying, and oil and gas extraction industries. The unemployment rate remains steady at 3.7%, while the labor force participation rate was flat at 62.5%. Wage growth rebounded to 4.5% from a year ago, well above the 4.1% estimate and the best level since September. Investors viewed the report as good news being bad news, driving interest rates higher on worries about the impact on Fed policy. This impressive report echoed the JOLTS job openings report from earlier in the week that showed an uptick in openings to 9.0 million, with roughly 1.5 jobs open for every unemployed individual.
The FOMC meeting unsurprisingly ended with no change to the Fed Funds target rate, though the tone of the statement and press conference was viewed as hawkish. Chair Powell was clear that the committee doesn’t expect to reduce rates until it has greater confidence that inflation is under control. He did, however, reiterate that the committee is focused on avoiding being too tight and that labor market weakness is not a prerequisite for rate cuts. Between these comments and the payroll report, the expectations for rate cuts have moderated. The odds of a cut in March fell from 85% at the beginning of the year to 20% on Friday, and the total expected cuts this year fell from more than six to less than five.
Earnings season reached its peak this week, with more than one-third of the S&P 500 companies reporting. The sluggish trend reversed slightly this week, with the trend now suggesting growth of 2% in the fourth quarter, compared with a week ago when it was trending towards -2%. The best growth has been seen in communication services, consumer discretionary, and utilities, while energy, materials, and health care are the weakest. The consensus estimate for 2024 remains resilient, with only modest declines since the summer, and reflecting expected earnings growth of 11% on 5% revenue growth. Importantly, earnings sentiment has been improving on a better-than-expected macro environment and easing inflation.
The surge of momentum continued this week for equity markets, with the S&P 500® Index, the Dow Jones Industrial Average, and the NASDAQ Composite each gaining roughly 1%. Growth indexes beat value, while large caps beat small caps. Leading sectors for the week included consumer discretionary, consumer staples, and health care, while real estate, energy, and utilities lagged. Volatility remains modest, with the VIX closing the week below 14 for the 12th straight week. Trading volumes were average.
Global markets struggled this week, with the MSCI EAFE and MSCI Emerging Market Indexes both underperforming the S&P 500. Asian markets were mixed, with China losing 5%, with the CSI 300 at the lowest level since 2019 on growth concerns, while South Korea gained 5% on encouraging inflation data. European markets were mostly lower on hawkish central bank commentary and core inflation data ahead of expectations. France, the UK, and Germany all lost 1%, while Italy was flat and Spain gained 1%. Latin America was mixed despite the sharp drop in oil prices, with Mexico gaining 2% and Brazil losing 3%. The trade-weighted dollar index rose by 1%, approaching the highest level since November.
Interest rates were mixed this week despite the shifting expectations for Fed policy and the hot payroll report. The 10-year Treasury yield fell 0.10% to 4.04% and the 2-year yield rose by 0.05% to 4.38%, resulting in further inversion of the yield curve. Volatility in the bond market was elevated, with the MOVE Index jumping to the highest level in three weeks. Credit spreads remain very tight. Commodity prices were sharply lower despite strong macro data, with the S&P Goldman Sachs Commodity Index falling 4%. Crude prices plummeted by 8% on growth concerns in China and efforts to calm tensions in the Middle East. Natural gas prices fell another 5% to the lowest level since the early stages of the pandemic on seasonally warm weather.
Investors continue to shift towards a risk-on posture, with equity funds and ETFs attracting $20 billion in the latest week, bringing the year-to-date total to $37 billion. Despite the tough market, China fund flows have been the largest on record over the past four weeks. Bond funds attracted $6 billion, with investment grade posting inflows for the past 14 weeks. Money market funds continue to grow, adding $15 billion for the week and $171 billion so far in 2024. Investor sentiment remains strong but not excessive, with the CNN Fear & Greed at 67 on a scale from 0-100. The AAII Sentiment Survey showed bulls surging to 49% (the highest reading of the year) from 39% last week, more than double the number of bears.
A comparably light week of data awaits following the wave of news this week. Releases include PMI and ISM data on Monday and consumer credit on Wednesday. Earnings season will be the primary focus of investors, with more than 100 members of the S&P 500 set to report.
This material is not a recommendation to buy or sell a financial product or to adopt an investment strategy. Investors should work with their financial professional to discuss their specific situation.
Except where otherwise indicated, the views and opinions expressed are those of Nationwide as of the date noted, are subject to change at any time and may not come to pass.
S&P 500® Index: An unmanaged, market capitalization-weighted index of 500 stocks of leading large-cap U.S. companies in leading industries; it gives a broad look at the U.S. equities market and those companies’ stock price performance.
S&P Goldman Sachs Commodity Index: A benchmark for investment in the commodity markets and as a measure of commodity performance over time. It is a tradable index that is readily available to market participants of the Chicago Mercantile Exchange.
S&P Indexes are trademarks of Standard & Poor’s and have been licensed for use by Nationwide Fund Advisors. The Products are not sponsored, endorsed, sold or promoted by Standard & Poor’s and Standard & Poor’s does not make any representation regarding the advisability of investing in the Product.
MSCI EAFE® Index: An unmanaged, free float-adjusted, market capitalization-weighted index that is designed to measure the performance of large-cap and mid-cap stocks in developed markets as determined by MSCI; excludes the United States and Canada.
MSCI Emerging Markets® Index: An unmanaged, free float-adjusted, market capitalization-weighted index that is designed to measure the performance of large-cap and mid-cap stocks in emerging-country markets as determined by MSCI.
Funds are not sponsored, endorsed, or promoted by MSCI, and MSCI bears no liability with respect to any such funds or securities or any index on which such funds or securities are based.
Nationwide Funds are distributed by Nationwide Fund Distributors LLC, member FINRA, Columbus, Ohio. Nationwide Investment Services Corporation, member FINRA, Columbus, Ohio.
Nationwide, the Nationwide N and Eagle and Nationwide is on your side are service marks of Nationwide Mutual Insurance Company. © 2024 Nationwide
NFN-1584AO

