

Shifts in stock market leadership can be extreme
Small caps have led the market recently, taking over from large caps. What will it take for the rally to continue?

In my weekly capital markets review, I cover the factors that have influenced market movements, share insights on stock market performance, and connect the dots on key events to watch for in the upcoming weeks.
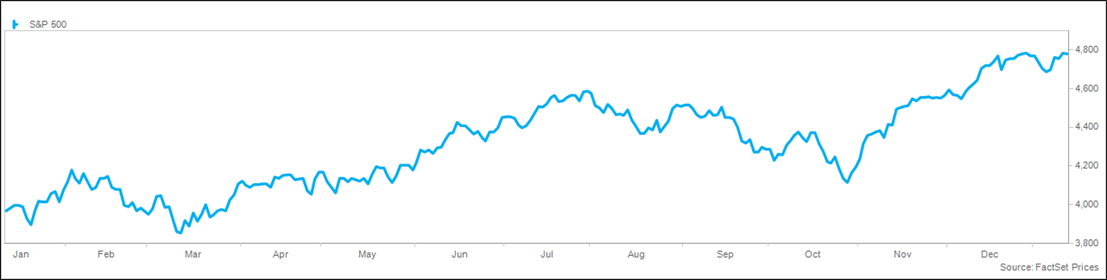
The equity market rebounded in the second week of the year, more than offsetting the decline in the first week and bringing the S&P 500® Index to within points a record high. Investors this week were encouraged by inflation data and commentary from consumer-oriented companies, largely ignoring rising tensions in the Middle East. The tech sector returned to leadership this week, with the Russell 1000® Growth Index surging 4%, though strength was also seen in consumer companies, banks, and cyclicals. Earnings will be the next hurdle for markets, with banks unofficially opening earnings season on Friday, potentially setting the tone for the year. The balance between bulls and bears is in greater balance than at any time since the pandemic began, with the tailwind from technical factors likely handing off to fundamentals as earnings season begins.
The primary driver of the market rally since October 2022 has been technical factors, with the near-universal bearishness at the market bottom leading to a sustained rally as the news exceeded the pessimistic consensus. Conversely, the pendulum has swung dramatically, with greater optimism among investors and economists, setting the bar to exceed expectations much higher. The bear case for 2024 is that the consensus is now too optimistic on the outlook for the economy and the market despite some significant challenges. For example, the traditional “canaries in coalmines,” notably the yield curve and leading indicators, continue to point to a recession. Additionally, the labor market is experiencing a slowdown, further exacerbated by the challenge of higher rates – a situation that hasn’t been faced in recent years. Despite the challenges, a “soft landing” is being priced into equity markets, with confidence that the Federal Reserve can control inflation without “breaking” the economy, despite history suggesting that is a difficult task. That said, if the economy enters a recession and earnings deteriorate, the pendulum of investor confidence and positioning will shift, causing a market reaction.
Inflation data this week was encouraging to investors. Thursday’s reading on consumer price inflation was a bit hotter than expected, with headline CPI up 3.4% from a year ago (above the 3.2% consensus and 3.1% in November) and core up 3.9% (versus 3.8% consensus and 4.0% in November). Investors largely shrugged off the upside to consensus, as two-thirds of the year-over-year increase was driven by shelter costs (+6.2%) that are impacted by the lag in the calculation of owner-equivalent rent. Wages remain under control, up just 0.8% from a year ago. Producer price inflation rose just 1.0% in December, below the 1.4% consensus but up from 0.8% in November. Core PPI rose 1.8%, below the 2.0% consensus and November reading. Easing pressure on producer prices is likely to lead to lower consumer price pressure in the coming months.
Earnings season unofficially kicked off on Friday with reports from several large banks, including Citi, JPMorgan, and Wells Fargo. The results were mixed, with upside to net interest income offsetting pressure on fees. The consensus estimate is for the S&P 500 to deliver flat earnings from a year ago on 3% revenue growth. This is a significant drop from the 8% growth expected when the quarter began, the largest decline within a quarter since the third quarter of 2022. The outlook weakened for nine of 11 sectors, led by health care and utilities. Close attention will be paid to the market reaction to reports following the disappointing reaction to beats in the previous quarter. Also, the outlook for 2024 could drive markets, with the current consensus forecasting 11% growth following the flat year in 2023.
Geopolitical tension accelerated this week, with the US and UK launching missile strikes on 60+ targets in Yemen aimed at degrading the Iran-backed Houthi rebels’ ability to disrupt the Red Sea. This followed news that Iran recently seized a tanker off Oman and Israel continued to hit Hezbollah targets in Lebanon. Crude prices rose modestly in reaction, while the impact on the supply chain could further pressure inflation in the coming months.
The market rallied this week, with the S&P 500® Index briefly touching a record high before easing a bit Friday afternoon. The S&P 500 gained 2%, the Dow added 1%, and the NASDAQ jumped 3%. Growth indexes outperformed value, while large caps beat small caps. Leading sectors for the week included technology, communication services, and consumer discretionary, while energy, utilities, and materials lagged. Volatility continues to be modest, with the VIX closing below 14 for the ninth straight week, while trading volume was modest.
Global markets were mixed this week, with developed markets reacting to incrementally positive economic confidence, while emerging markets reacting to geopolitical events. In Asia, Japan surged by 5% as the Nikkei surged to a record high, while China lost 2% on a drop in exports. European markets were mixed, with France and Italy adding 1%, the UK and Germany little changed, and Spain losing 1%. Latin America was lower on uncertainty in the commodity market, with Brazil and Mexico 1% lower. The trade-weighted dollar index was fractionally higher and is now up 1% on the year.
Interest rates were lower this week following a jump last week, as investors reacted to the inflation data. The 10-year Treasury yield fell 0.09% to 3.95%, while the 2-year yield dropped 0.23% to 4.17% (the lowest level since May), bringing the spread between the two to just 0.22%. Global rates were little changed for the week, while credit spreads remain tight. Commodity prices were modestly higher due to economic confidence, with the S&P Goldman Sachs Commodity Index up less than 1%. Crude prices fell despite the disruption in the Middle East, falling 1% for the week to $73 per barrel. Industrial and precious metals and agricultural commodities were little changed for the week.
Investors continue to aggressively allocate to cash, adding $163 billion in the first two weeks of 2024, continuing the trend that saw $1.4 trillion of inflows in 2023. Bonds also saw strength, adding $14 billion, led by the largest inflow into investment grade since September of 2020. Equity funds and ETFs lost $7 billion despite strong inflows into technology and REITs. Investor sentiment remains stable, with the CNN Fear & Greed Index at 71 on a scale from 0 to 100, up from 70 last week. The AAII Sentiment Survey showed no change to the percentage responding as “bullish” (49%) and “bearish” (24%) this week.
Earnings season will be the primary area of focus next week, though only 22 members of the S&P 500 are set to report. Economic news releases are light, including retail sales on Wednesday, housing starts on Thursday, and existing home sales and consumer sentiment on Friday.
This material is not a recommendation to buy or sell a financial product or to adopt an investment strategy. Investors should work with their financial professional to discuss their specific situation.
Except where otherwise indicated, the views and opinions expressed are those of Nationwide as of the date noted, are subject to change at any time and may not come to pass.
S&P 500® Index: An unmanaged, market capitalization-weighted index of 500 stocks of leading large-cap U.S. companies in leading industries; it gives a broad look at the U.S. equities market and those companies’ stock price performance.
S&P Indexes are trademarks of Standard & Poor’s and have been licensed for use by Nationwide Fund Advisors. The Products are not sponsored, endorsed, sold or promoted by Standard & Poor’s and Standard & Poor’s does not make any representation regarding the advisability of investing in the Product.
Russell 1000® Growth Index: An unmanaged index that measures the performance of the large-capitalization growth segment of the U.S. equity universe; includes those Russell 1000® Index companies with higher price-to-book ratios and higher forecasted growth values.
Russell Investment Group is the source and owner of the trademarks, service marks and copyrights related to the Russell Indexes. The Fund is not sponsored, endorsed, or promoted by Russell, and Russell bears no liability with respect to any such funds or securities or any index on which such funds or securities are based. Russell ® is a trademark of Russell Investment Group.
Nationwide Funds are distributed by Nationwide Fund Distributors LLC, member FINRA, Columbus, Ohio. Nationwide Investment Services Corporation, member FINRA, Columbus, Ohio.
Nationwide, the Nationwide N and Eagle and Nationwide is on your side are service marks of Nationwide Mutual Insurance Company. © 2024 Nationwide
NFN-1572AO

