

Shifts in stock market leadership can be extreme
Small caps have led the market recently, taking over from large caps. What will it take for the rally to continue?

In my weekly capital markets review, I cover the factors that have influenced market movements, share insights on stock market performance, and connect the dots on key events to watch for in the upcoming weeks.
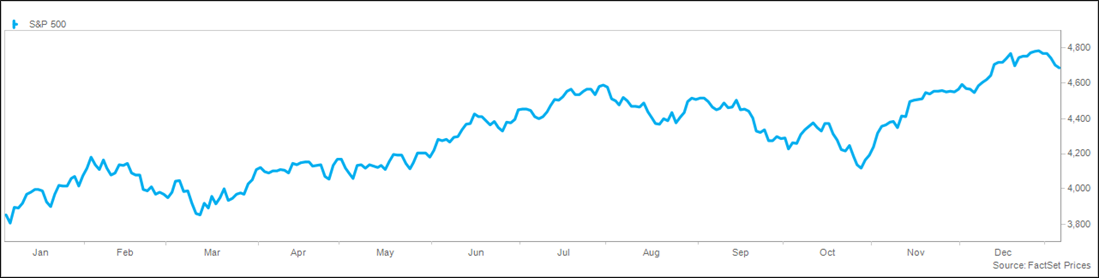
Equity markets paused to begin 2024, with the S&P 500® Index falling modestly this week after an impressive two-month rally that saw the S&P 500® Index rally 16% in the first eight-week winning streak since 2017. Investors have gradually eased their expectations for rate cuts as economic data has surprised to the upside, putting upward pressure on rates and downward pressure on equities. The broadening of market leadership continues, with the Magnificent 7 leading the decline, small caps beating large caps, and value beating growth. The tailwind from improving sentiment, strong momentum, and beneficial seasonality has likely faded as the calendar turns, with the next move for markets dependent on continued upside surprises from a fundamental perspective.
There is evidence of overbought conditions and exhaustion from the rally, paving the way for a natural period of consolidation. Positioning is extended, and investors are beginning to take a more cautious tone, with the latest flow data showing $123 billion flow into money market funds in the last week of 2023, bringing the year-to-date total to over $1.3 trillion. In 2023, the S&P 500® Index delivered a 26% return, ending four points higher than where it ended 2021. While there is historically no correlation (-0.11 R-squared) between returns in one year compared to the following year, a strong year has been a good omen for forward returns. Since 1950, the S&P 500 has returned greater than 20% on 20 occasions, with the next year being higher in 16 of the 20 times, with an average return of 10%.
December payroll growth was 216,000, well ahead of the 160,000 estimate and November’s 199,000. The unemployment rate was unchanged at 3.7% versus an expected 3.8%, though the labor force participation rate fell 0.3% to 62.5%, the lowest since February. Average hourly earnings rose 4.1% from a year ago, better than the 3.9% forecast, resulting in positive real wage growth for the seventh straight month. Following the report, the equity and bond market sold off modestly, as the better-than-expected report was seen as potentially limiting the number of FOMC rate cuts this year. The Fed Futures curve now embeds five cuts this year, down from six last week. The resiliency of the job market remains impressive, with the JOLTS job opening report showing 8.8 million unfilled jobs, with 1.4 openings per unemployed individual.
The consumer continues to be buoyed by the strong labor market and the emotional benefit from the wealth effect (capital and housing market prices), lower energy prices, and easing financial conditions, all acting as a tailwind. Reports on holiday spending have been healthy, with a strong Black Friday weekend and an encouraging finish to the season approaching Christmas. As a result of recent data, the Atlanta Fed’s GDPNow model for the fourth quarter jumped to 2.5%, versus the consensus of economists at 1.0%. We will get more information on the strength of the consumer in the coming weeks, with banks beginning to report earnings and consumer companies presenting at an industry conference.
Entering 2024, economists and strategists have published their views on the economy and the market, with economists incrementally optimistic but market strategists still cautious. Americans are pessimistic about the economy per a CNBC survey, with 66% negative about the state of the economy and the outlook, the weakest reading in the 17-year history of the survey. Bloomberg’s recession probability forecast shows a 50% chance of a recession over the next year, the lowest level since September 2022. Wall Street strategists, on average, have a cautious outlook for the market, with the average of those published looking for a gain of just 1%. A year ago, the consensus of strategists was similarly conservative, forecasting a gain of just 4% in 2023, which ended up being 22% below the actual performance.
Investors took a break following a strong move in equities, with the S&P 500® Index beginning the year with a 2% decline. The Dow was down less than 1%, while the NASDAQ fell more than 3%. Large caps beat small caps, while value outperformed growth. Leading sectors for the week included health care, utilities, and energy, while technology, consumer discretionary, and industrials lagged. Volatility was modestly higher for the week, though the VIX remains below average at 14. Trading volume was average.
Global markets fell in sympathy with domestic markets, with the MSCI EAFE and Emerging Market Indexes performing roughly in line with the S&P 500. In Asia, South Korea and China lost on slumping technology prices, while Japan lost just 1% despite nervousness surrounding a substantial earthquake. European markets were weak on a rebound in inflation, with France down 3%, Germany down 2%, Italy, the UK, and Spain down 1%. Latin America was lower despite rising oil prices, with Brazil and Mexico down 2%. The trade-weighted dollar index was higher for the week on higher rates but remains down 3% from a year ago.
Commodity prices were higher for the week on encouraging economic data and geopolitical risk, with the S&P Goldman Sachs Commodity Index up 1%. Crude prices jumped 3% on tensions in the Middle East and the Red Sea, while natural gas prices surged 12% on cooling weather. Precious metals fell on the stronger dollar, while agricultural commodities were mixed. Interest rates jumped this week on shifting expectations on Fed policy, with the 10-year yield up 0.16%. The 2-year yield jumped 0.14%, resulting in a modest yield curve steepening. Credit spreads remain tight while global rates rose.
Investors continue to allocate broadly to capital markets as investor sentiment improves. Equity markets saw inflows for the eighth time in 10 weeks, with $8 billion in the week and $82 billion over the last ten weeks. Bond funds attracted $11 billion, with investment-grade funds showing inflows for the 10th week, offsetting outflows from high yield for the first time in 10 weeks. Money markets continue to lead the way with $123 billion of inflows. Investor sentiment continues to improve, with the AAII survey showing bulls rising to 49% while bears fell to 24%. The CNN Fear & Greed Index eased modestly to 72 on a scale of 0-100, falling out of last week’s “extreme greed” category.
Inflation data will be in focus next week, including CPI on Thursday and PPI on Friday. Other notable data include consumer credit on Monday and NFIB Small Business on Tuesday.
This material is not a recommendation to buy or sell a financial product or to adopt an investment strategy. Investors should work with their financial professional to discuss their specific situation.
Except where otherwise indicated, the views and opinions expressed are those of Nationwide as of the date noted, are subject to change at any time and may not come to pass.
S&P 500® Index: An unmanaged, market capitalization-weighted index of 500 stocks of leading large-cap U.S. companies in leading industries; it gives a broad look at the U.S. equities market and those companies’ stock price performance.
S&P Indexes are trademarks of Standard & Poor’s and have been licensed for use by Nationwide Fund Advisors. The Products are not sponsored, endorsed, sold or promoted by Standard & Poor’s and Standard & Poor’s does not make any representation regarding the advisability of investing in the Product.
MSCI EAFE® Index: An unmanaged, free float-adjusted, market capitalization-weighted index that is designed to measure the performance of large-cap and mid-cap stocks in developed markets as determined by MSCI; excludes the United States and Canada.
MSCI Emerging Markets® Index: An unmanaged, free float-adjusted, market capitalization-weighted index that is designed to measure the performance of large-cap and mid-cap stocks in emerging-country markets as determined by MSCI.
The Fund is not sponsored, endorsed, or promoted by MSCI, and MSCI bears no liability with respect to any such funds or securities or any index on which such funds or securities are based.
Nationwide Funds are distributed by Nationwide Fund Distributors LLC, member FINRA, Columbus, Ohio. Nationwide Investment Services Corporation, member FINRA, Columbus, Ohio.
Nationwide, the Nationwide N and Eagle and Nationwide is on your side are service marks of Nationwide Mutual Insurance Company. © 2024 Nationwide
NFN-1568AO

