

Shifts in stock market leadership can be extreme
Small caps have led the market recently, taking over from large caps. What will it take for the rally to continue?

Lost in the recent clamor over geopolitical risks and rising interest rates was the passing of the one-year anniversary of the current bull market. The S&P 500® Index gained 22% over the 12 months since the bear market low of October 12, 2022. That seems like a solid return, but it’s lackluster compared to prior rallies at the start of bull markets.
In reviewing historical stock data, the 22% return of the current bull market is the weakest 12-month return for a new bull market since 1950. In the 12 months following previous bear market lows, returns have averaged 39%.
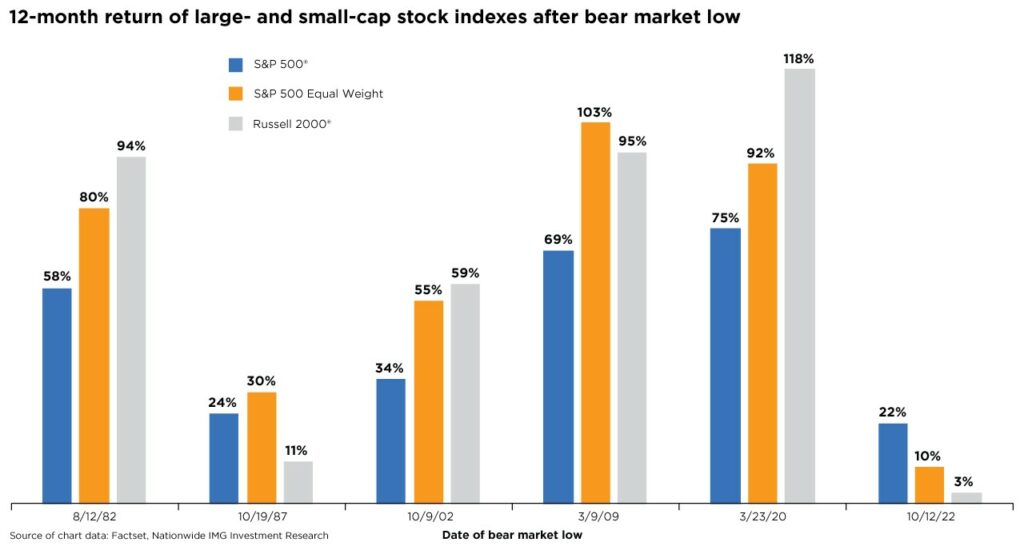
What explains this relatively tepid performance? First, market breadth in the current rally has been thin. As of this writing, only 16% of S&P 500 constituents are above their 50-day moving averages. Second, most of the S&P 500’s gains over the past 12 months have come from just a handful of large-cap stocks. The ten largest stocks in the S&P 500 have accounted for almost 96% of the index’s year-to-date return as of the end of September. This split becomes apparent when comparing the S&P 500’s 22% return to the 10% return of the S&P 500 Equal Weight Index, which measures the performance of all 500 stocks equally instead of giving more weight to the biggest companies in the index.
Third, small-cap stocks are barely positive over the same period, marking their worst bear-market rebound in over 100 years, as higher interest rates and fears of an economic slowdown rattled investor confidence. Investors will be better suited to navigate shifting economic and market headwinds by combining a long-term investment plan with historical insights grounded in data, not emotion.
This material is not a recommendation to buy or sell a financial product or to adopt an investment strategy. Investors should work with their financial professional to discuss their specific situation.
Except where otherwise indicated, the views and opinions expressed are those of Nationwide as of the date noted, are subject to change at any time and may not come to pass.
S&P 500® Index: An unmanaged, market capitalization-weighted index of 500 stocks of leading large-cap U.S. companies in leading industries; it gives a broad look at the U.S. equities market and those companies’ stock price performance.
S&P Indexes are trademarks of Standard & Poor’s and have been licensed for use by Nationwide Fund Advisors. The Products are not sponsored, endorsed, sold or promoted by Standard & Poor’s and Standard & Poor’s does not make any representation regarding the advisability of investing in the Product.
Nationwide Funds are distributed by Nationwide Fund Distributors LLC, member FINRA, Columbus, Ohio. Nationwide Investment Services Corporation, member FINRA, Columbus, Ohio.
Nationwide, the Nationwide N and Eagle and Nationwide is on your side are service marks of Nationwide Mutual Insurance Company. © 2023 Nationwide
NFN-1538AO

