

Shifts in stock market leadership can be extreme
Small caps have led the market recently, taking over from large caps. What will it take for the rally to continue?

In my weekly capital markets review, I cover the factors that have influenced market movements, share insights on stock market performance, and connect the dots on key events to watch for in the upcoming weeks.
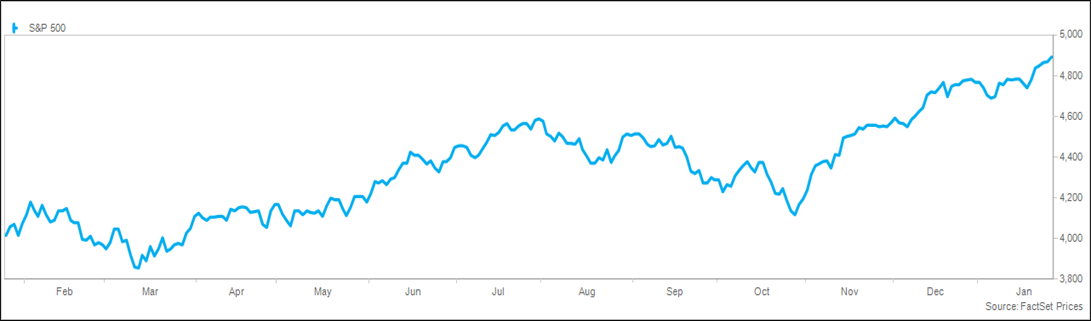
Equity markets continue their impressive breakout, with the S&P 500® Index hitting five consecutive record highs on Thursday after a gap of more than 500 days (sixth longest on record). The S&P 500 delivered the third-straight weekly gain and the 12th in the past 13 weeks dating back to the beginning of November. Over that period, the index has rallied 19%, with a year-to-date gain of nearly 3%. The Goldilocks economic data (strong growth, easing inflation) eased investor concerns heading into the FOMC meeting next week. The rally was broad-based, led by small caps and emerging markets. Bond markets also gained on falling rates and tightening credit spreads, with the correlation between stocks and bonds continuing to be positive. The impressive technical rally was reinforced this week with encouraging macro data.
Sentiment is shifting bullish, but not at extreme levels. The Bank of America Bull & Bear Indicator rose to 6.0 (a scale from 0 to 10) from 5.5 last week on strong stock inflows, positive equity market breadth, and encouraging credit technicals. Positioning is not extreme, with the NAAIM Exposure Index falling to 54 from 80 last week and 103 at the beginning of the month. Deutsche Bank data said its measure of aggregate equity positioning has been moving sideways in a tight range since mid-December at a modestly overweight level, while JPMorgan noted that flows and positioning have not been out of line with the market trends. Goldman Sachs’s Risk Appetite Indicator is elevated, but not at an extreme.
The economy continues to confound economists, with fourth-quarter GDP growth of 3.3% compared with the consensus estimate of 1.8% and the Atlanta Fed’s GDPNow model forecast of 2.4%. For the full year, growth was 2.5%, better than 1.9% in 2022, while the overwhelming consensus of economists coming into 2023 was expecting a recession. The upside was driven by strong consumer spending, contributing 1.9% of the gain, with capital spending adding 0.3%, inventories adding 0.1%, net exports adding 0.4%, government spending adding 0.6%, and housing flat. Other economic data reinforced the economic momentum, with PMI at 52.3 versus 5.9 in December, with manufacturing PMU above 50 (indicating expansion) for the first time since last April. Leading indicators continue to paint a pessimistic picture, falling for the 22nd straight month, though it was the best reading in nearly two years. The current consensus for the first quarter is 0.6% and the full year 2024 is 1.3%.
While the economy continues to surprise to the upside, earnings season is painting a more tepid picture of the macro environment. To date, 25% of S&P 500 companies have reported, tracking towards a decline of 2% from a year ago. Communication services, utilities, and consumer discretionary are showing growth of greater than 20%, while energy, health care, and materials are shrinking by more than 20%. Below the surface, the picture is more pessimistic than the headlines. The “Magnificent 6” (Apple, Microsoft, Amazon, Google, Meta, and Nvidia) is expected to grow earnings by over 50% in the quarter, while the remainder of the S&P 500 is expected to see a decline of 11%. Next week is the peak of earnings season, with roughly 40% of the S&P 500 set to report.
Investors continue their risk-on shift, with equity markets showing steady gains. The S&P 500® Index, the Dow, and the NASDAQ all gained roughly 1% for the week. Growth and value indexes performed roughly in line, while small caps beat large caps. Communication services, energy,and financials led, while consumer discretionary, real estate and health care lagged. Volatility remained muted, with the VIX closing below 14 for the 11th straight week.
Global markets were strong this week on aggressive stimulus actions in China to stem the economic weakness, with the MSCI EAFE Index gaining 2% and the MSCI Emerging Market Index higher by 1%. In Asia, China led the way higher with a 5% gain, though the CSI 300 has underperformed the S&P 500 by 42% over the past 12 months. South Korea and Japan were little changed. European markets were substantially higher on dovish comments from the ECB, with France gaining 3%, Germany and the UK adding 2%, and Italy and Spain down fractionally. Latin America benefitted from higher oil prices, with Brazil and Mexico adding 1%. The trade-weighted dollar index was modestly stronger and has gained 2% this year.
Interest rates were little changed for the week, with strong economic data offsetting lower inflation prints. The 10-year Treasury yield rose 0.02% to 4.15%, while the 2-year yield fell 0.02% to 4.35%, steepening the yield curve modestly. Credit spreads continued to tighten, while global yields were modestly higher. Commodity prices were notably strong on stimulus in China and encouraging macro data, with the S&P Goldman Sachs Commodity Index 3% higher for the week. Crude prices jumped 5%, now 7% higher for the year on the prospect of higher demand, while natural gas prices fell 6% on warmer weather. Metals prices were mixed, while agricultural commodities were strong.
Investor sentiment has been surprisingly mixed in recent weeks, with the AAII Sentiment Survey showing bulls at the lowest level since November despite the strong market. The CNN Fear & Greed Index ticked into “extreme greed” territory at 77 on a scale from 0 to 100. Fund flows remain strong, with equity funds and ETFs attracting $18 billion in the latest week, driven by record inflows into emerging market funds and strong gains in technology funds. Bond funds attracted $14 billion, with investment grade gaining for the 13th week, with the largest 4-week flow ($39 billion) in nearly three years. Money market funds added $7 billion, bringing the year-to-date total to $156 billion.
A busy week awaits, including a surge in earnings announcements and the FOMC meeting. Economic data include consumer confidence and JOLTS job openings on Tuesday, ISM, PMI, and productivity data on Thursday, and the monthly payroll report, durable goods, and consumer sentiment on Friday.
This material is not a recommendation to buy or sell a financial product or to adopt an investment strategy. Investors should work with their financial professional to discuss their specific situation.
Except where otherwise indicated, the views and opinions expressed are those of Nationwide as of the date noted, are subject to change at any time and may not come to pass.
S&P 500® Index: An unmanaged, market capitalization-weighted index of 500 stocks of leading large-cap U.S. companies in leading industries; it gives a broad look at the U.S. equities market and those companies’ stock price performance.
S&P Goldman Sachs Commodity Index: A benchmark for investment in the commodity markets and as a measure of commodity performance over time. It is a tradable index that is readily available to market participants of the Chicago Mercantile Exchange.
S&P Indexes are trademarks of Standard & Poor’s and have been licensed for use by Nationwide Fund Advisors. The Products are not sponsored, endorsed, sold or promoted by Standard & Poor’s and Standard & Poor’s does not make any representation regarding the advisability of investing in the Product.
MSCI EAFE® Index: An unmanaged, free float-adjusted, market capitalization-weighted index that is designed to measure the performance of large-cap and mid-cap stocks in developed markets as determined by MSCI; excludes the United States and Canada.
MSCI Emerging Markets® Index: An unmanaged, free float-adjusted, market capitalization-weighted index that is designed to measure the performance of large-cap and mid-cap stocks in emerging-country markets as determined by MSCI.
Funds are not sponsored, endorsed, or promoted by MSCI, and MSCI bears no liability with respect to any such funds or securities or any index on which such funds or securities are based.
Nationwide Funds are distributed by Nationwide Fund Distributors LLC, member FINRA, Columbus, Ohio. Nationwide Investment Services Corporation, member FINRA, Columbus, Ohio.
Nationwide, the Nationwide N and Eagle and Nationwide is on your side are service marks of Nationwide Mutual Insurance Company. © 2024 Nationwide
NFN-1580AO

