

Shifts in stock market leadership can be extreme
Small caps have led the market recently, taking over from large caps. What will it take for the rally to continue?

Market narratives can help investors by offering a cohesive framework to make sense of different market dynamics. For example, for much of 2023, investors were fixated on the historically high concentration of the “Magnificent 7” stocks in S&P 500® Index returns and convinced that the Federal Reserve would lower the Fed funds target rate before the end of 2023. Yet, by year-end, the Fed was holding steady on interest rate changes, while the performance of the “Magnificent 7” stock exceeded even their elevated expectations.
Curiously, as interest rates remained high throughout 2023, company earnings for 2023 were lackluster at best compared to the prior year. Still, the S&P 500 returned close to 26% for 2023, driven primarily by multiple expansions. The S&P 500 began the year at approximately 16 times forward earnings and ended at about 19.5 times forward earnings. So, why did the price/earnings (P/E) ratio expand while inflation remained troublesome, interest rates remained restrictive, and earnings growth was tepid? Ultimately, the equity market trades on future expectations of what will occur. The P/E expansion in 2023 may have been signaling the disinflation trends many investors expect as 2024 unfolds.
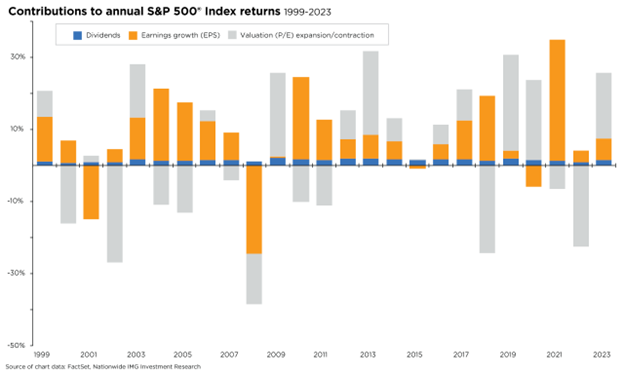
Although narratives can help explain the market’s performance, sometimes deconstructing the returns for the S&P 500 Index can provide more understanding. The accompanying chart shows how changes in dividends, earnings growth, and multiple expansions contributed to the annual returns for the S&P 500 from year to year. We can highlight some interesting observations from this chart. First, dividend returns are relatively modest but consistent over time. Second, earnings growth has been consistently positive over time, with a few exceptions during recessionary periods. Finally, P/E expansion has been the least stable, with significant fluctuations from year to year. Investors should note that in 13 out of 25 years, earnings growth and valuations moved in opposite directions.
While there may be debates around the narratives driving the equity market’s return in any given year, earnings growth remains the most critical factor for long-term investors. Valuation changes, however, contribute significantly to market volatility.
This material is not a recommendation to buy or sell a financial product or to adopt an investment strategy. Investors should work with their financial professional to discuss their specific situation.
Except where otherwise indicated, the views and opinions expressed are those of Nationwide as of the date noted, are subject to change at any time and may not come to pass.
S&P 500® Index: An unmanaged, market capitalization-weighted index of 500 stocks of leading large-cap U.S. companies in leading industries; it gives a broad look at the U.S. equities market and those companies’ stock price performance.
S&P Indexes are trademarks of Standard & Poor’s and have been licensed for use by Nationwide Fund Advisors. The Products are not sponsored, endorsed, sold or promoted by Standard & Poor’s and Standard & Poor’s does not make any representation regarding the advisability of investing in the Product.
Nationwide Funds are distributed by Nationwide Fund Distributors LLC, member FINRA, Columbus, Ohio. Nationwide Investment Services Corporation, member FINRA, Columbus, Ohio.
Nationwide, the Nationwide N and Eagle and Nationwide is on your side are service marks of Nationwide Mutual Insurance Company. © 2024 Nationwide
NFN-1571AO

