
Opportunities for small caps in a changing economic climate
Small caps may offer your long-term investor clients some potential opportunities for growth.

With the second half of 2024 set to kick off next week, it’s a good time to reflect on one of the most compelling stock market stories of the year: the recent series of all-time highs, with the S&P 500® Index exceeding 31 as of this writing. This performance sets the stage for an intriguing second half of the year.
While this stellar performance for the S&P 500 is a win for investors tracking returns at the Index level, there’s more cause for concern below the surface. Through June 21, the S&P 500 has earned a respectable gain of over 15% for the year. At the same time, the average drawdown for stocks in the red for the year-to-date is also around 15%.
This year, the S&P 500’s positive performance has come even as momentum has diverged, and market breadth has decreased. Let’s look at momentum first. The S&P 500 has been minting new all-time highs despite a fall-off in the cumulative advance/decline line since May. (The advance/decline line represents the total number of stocks advancing on the day minus those declining over a specific time frame.)
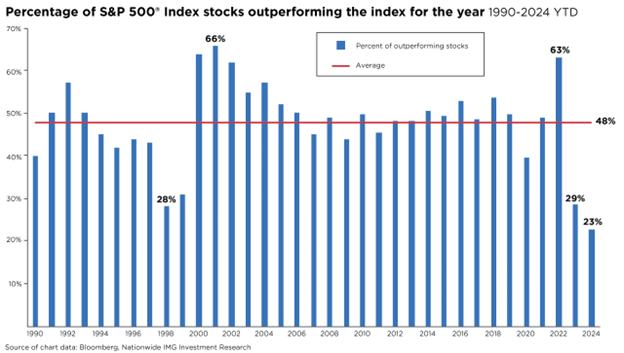
Further, just five stocks have contributed nearly 60% of the S&P 500’s total year-to-date return. While the average stock in the Index is up approximately 6%, over the last 30 days, only 27% of S&P 500 constituents have outperformed the Index. Even as the Index has increased, most stocks have failed to keep pace. For the year, just 23% of stocks are outpacing the S&P 500, which is on track to be the lowest amount in the last 25 years.
With market breadth, the story is just as concerning. As of this writing, only 46% of S&P 500 stocks are above their short-term 20-day moving averages. Similarly, as the S&P 500 continues to set new all-time highs, the number of stocks making new 20-day highs has remained uninspiring. In technical jargon, no “breadth thrust” supports the current uptrend.
These grim technical factors may not necessarily indicate the bull market is over. Breadth divergence is a signature of this recent rally, with the S&P 500 driven by a small cohort of names. Still, investors must remember that a consolidation phase until breadth metrics improve might be a healthy response to the torrid market rally.
This material is not a recommendation to buy or sell a financial product or to adopt an investment strategy. Investors should work with their financial professional to discuss their specific situation.
Except where otherwise indicated, the views and opinions expressed are those of Nationwide as of the date noted, are subject to change at any time and may not come to pass.
S&P 500® Index: An unmanaged, market capitalization-weighted index of 500 stocks of leading large-cap U.S. companies in leading industries; gives a broad look at the U.S. equities market and those companies’ stock price performance.
S&P Indexes are trademarks of Standard & Poor’s and have been licensed for use by Nationwide Fund Advisors. The Products are not sponsored, endorsed, sold or promoted by Standard & Poor’s and Standard & Poor’s does not make any representation regarding the advisability of investing in the Product.
Nationwide Funds are distributed by Nationwide Fund Distributors LLC, member FINRA, Columbus, Ohio. Nationwide Investment Services Corporation, member FINRA, Columbus, Ohio.
Nationwide, the Nationwide N and Eagle and Nationwide is on your side are service marks of Nationwide Mutual Insurance Company. © 2024 Nationwide
NFN-1665AO