Capital Market Impact

What to Watch This Week: Geopolitical Tensions, a Strong Start to Earnings Season, and the Strength of the Global Consumer

October 16, 2023
A mobile device in hands.

Thoughts

  • Markets continued to recover from the rough two-month stretch, with the S&P 500® Index delivering a modest gain for the second straight week and beginning the seasonally-strong fourth quarter with back-to-back gains. The equity and bond markets remain positively correlated, with yields off sharply from last week. Geopolitical tension was in focus this week with the conflict in Israel, though the equity market remained reasonably calm. Thursday marked the one-year anniversary of the market bottom, with the S&P 500 returning 20% over that period, led by a 44% gain in technology and 41% for communication services, while utilities lost 7% and consumer staples fell by 2%. Over the same period, the gain for the Bloomberg US Aggregate Bond Index returned 1%.
  • Risk metrics have moderated as the market has stabilized. Credit spreads across various asset classes, from commercial paper to high yield, have registered a slight increase yet remain within a reasonably modest range. Equity and bond market volatility remain elevated but sentiment indicators, including CNN Fear & Greed and Global Fear & Greed, are all up substantially this month, while the put/call ratio has moderated, and the S&P 500 bounced strongly off the 200-day moving average. Markets continue to shrug off troubling geopolitical news, with investors avoiding emotional reactions and instead focusing on the surprisingly robust economic and earnings backdrop. Watching earnings season will be critical in determining if this momentum can continue.
  • Amid the tensions in the Middle East, we have yet to see an itchy trigger finger from investors. When we consider using history as a gauge to assess the potential impact on the financial markets, it is evident that there is often a negative initial reaction to geopolitical events but underlying factors such as corporate profits and economic growth drive the long-term performance. Investors should remember that markets are very resilient, have endured countless wars, recessions, and depressions, and have rewarded long-term investors with a well-crafted financial plan. Take a look at the chart below to see S&P 500 performance following significant historical events over the decades.

News

  • Earnings season unofficially kicked off this week, led by several high-profile banks reporting Friday. Just 5% of S&P 500 companies have reported, and third-quarter growth is forecasted to be up by less than 1% on 2% revenue growth. So far, 84% have exceeded estimates by an average of 10% (compares to long-term average of 74% and 4%, respectively) as we look for the first positive quarter in four. Coming into the quarter, earnings revision momentum is at the strongest level in seven quarters. Trends in guidance recently include margin strength offsetting signs of slowing sales growth and pricing power.
  • Consumer spending and the strength of the global consumer will be primary drivers of this earnings season, and investors are closely watching for signs of an inflection point. Through September, there were few signs of strain, with personal spending up 5.8% from a year ago on income that rose 4.8%. Piper Sandler’s daily consumer confidence measure dropped sharply last week on geopolitical risk, the situation in the House of Representatives, and elevated inflation. The University of Michigan’s Consumer Sentiment dropped sharply this month to the lowest level since May, driven by weakness in current conditions and expectations, with the outlook for inflation over the next year up to 3.8% from 3.2% last month.
  • Inflation continues to be stubbornly high, with the September consumer price index hotter than expected at 3.7% from a year ago, flat from August. Core CPI was in line with expectations at 4.1%, down from 4.3% the previous month, but still more than double the Fed’s target. Real wages were positive from a year ago for the fourth straight month after being negative for the previous 25 months. Shelter costs remain a frustrating contributor to the elevated reading on inflation, accounting for roughly one-third of the calculation, accelerating to 0.6% sequential growth and up 7.2% from a year ago. The Atlanta Fed’s reading on sticky inflation (a weighted basket of items that change price relatively slowly) accelerated to 5.5% annualized and up 5.1% from a year ago, while flexible CPI is up just 3.9% annualized and 1.0% from a year ago.

What to Watch

  • Earnings season accelerates this week, with 11% of S&P 500 companies scheduled to report. Economic data includes retail sales and industrial production on Wednesday, housing starts on Thursday, and existing home sales and leading indicators on Friday.

S&P 500 Performance Following Significant Historical Events

10/16/23

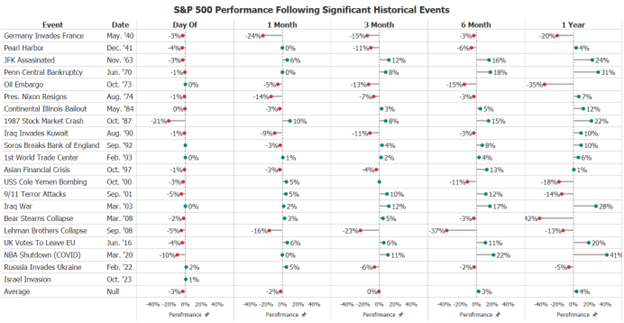
Source: Strategas, Factset

Sources/Disclaimer

  • This material is not a recommendation to buy or sell a financial product or to adopt an investment strategy. Investors should discuss their specific situation with their financial professional.

    S&P 500® Index: An unmanaged, market capitalization-weighted index of 500 stocks of leading large-cap U.S. companies in leading industries; gives a broad look at the U.S. equities market and those companies’ stock price performance.

    S&P Indexes are trademarks of Standard & Poor’s and have been licensed for use by Nationwide Fund Advisors.  The Products are not sponsored, endorsed, sold or promoted by Standard & Poor’s and Standard & Poor’s does not make any representation regarding the advisability of investing in the Product.

    Bloomberg ​US Aggregate Bond Index: An unmanaged, market value-weighted index of U.S. dollar-denominated, investment-grade, fixed-rate, taxable debt issues, ​which ​includes Treasuries, government-related and corporate securities, mortgage-​backed ​securities (agency fixed-rate and hybrid adjustable-rate ​mortgage pass-throughs), asset-backed ​securities and commercial ​mortgage-backed ​securities (agency and non-agency).

    Bloomberg and its indexes are service marks of Bloomberg Finance L.P. and its affiliates including Bloomberg Index Services Limited, the administrator of the index, and have been licensed for use for certain purposes by Nationwide. Bloomberg is not affiliated with Nationwide, and Bloomberg does not approve, endorse, review or recommend this product. Bloomberg does not guarantee the timeliness, accurateness, or completeness of any date or information relating to this product.

    Nationwide Funds distributed by Nationwide Fund Distributors LLC (NFD), member FINRA, Columbus, Ohio. NFD is not affiliated with any subadviser contracted by Nationwide Fund Advisors, with the exception of Nationwide Asset Management, LLC.  Nationwide Investment Services Corporation, member FINRA, Columbus, Ohio.

    Nationwide, the Nationwide N and Eagle, and Nationwide is on your side are service marks of Nationwide Mutual Insurance Company. © 2023 Nationwide

MFN-0886AO